Market Analysis – October 10
USOil retains persistent downward momentum under a fragile technical structure. The asset continues to exhibit a clear bearish configuration as analytical indicators remain aligned with a declining trajectory. Price action currently trades below the 9-day Simple Moving Average, signaling diminishing bullish strength and limited rebound potential. The MACD histogram remains in negative territory, with the signal line positioned beneath the equilibrium level, reflecting a subdued market tone and declining demand pressure. Altogether, these readings emphasize a supply-driven environment, supporting the likelihood of further weakness within the prevailing trend.
USOil Key Levels
Resistance Levels: $66.40, $72.20, $80.70
Support Levels: $61.50, $55.20, $52.00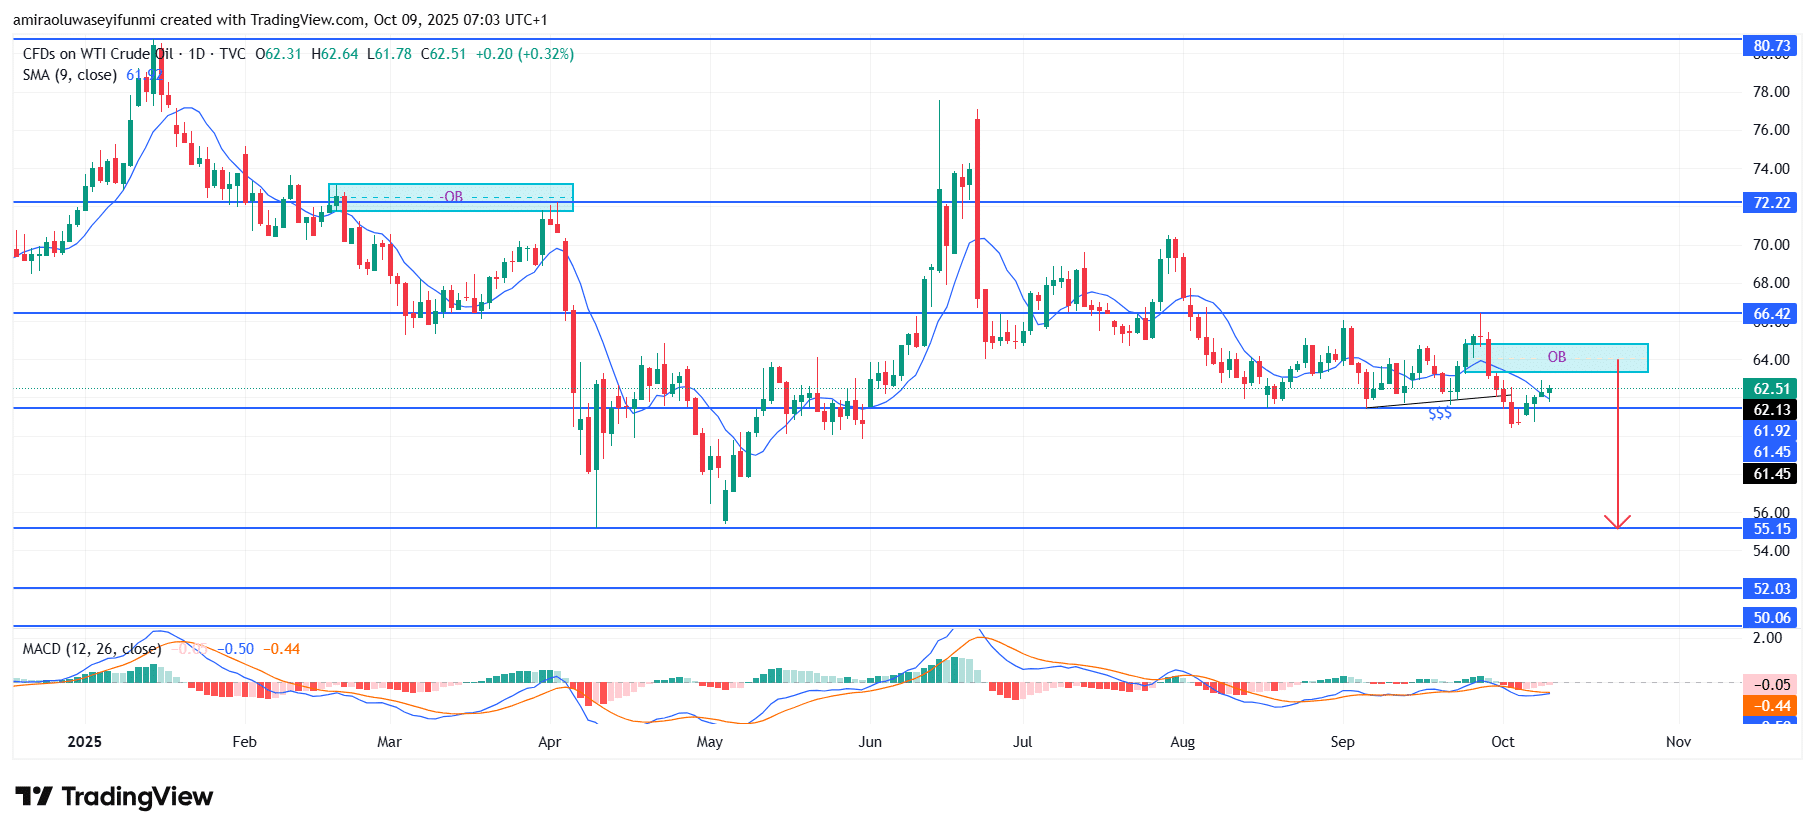
USOil Long-Term Trend: Bearish
From a structural perspective, price action reveals a clear rejection near the $66.40 distribution block, where prior liquidity was absorbed. Subsequent attempts to reclaim upward momentum have consistently failed below $63.00, forming a sequence of lower highs and shallow corrective movements. The interim demand area between $61.50–$61.99 now acts as a weak support zone, susceptible to renewed selling pressure. Market behavior indicates a sustained distribution pattern, with repeated rejections restricting recovery efforts and reaffirming dominance by bearish participants.
Looking ahead, a sustained break below $61.50 could trigger further declines toward the $55.20 base level, with extended weakness possibly testing the $52.00 region. The bearish outlook will remain valid unless a confirmed reaccumulation phase lifts prices above $66.40, which would neutralize the current downward structure. Without such a reversal, momentum is expected to favor sellers, maintaining a defensive stance for USOil over the mid-term horizon. Traders following forex signals may monitor this setup for potential continuation entries aligned with the dominant trend.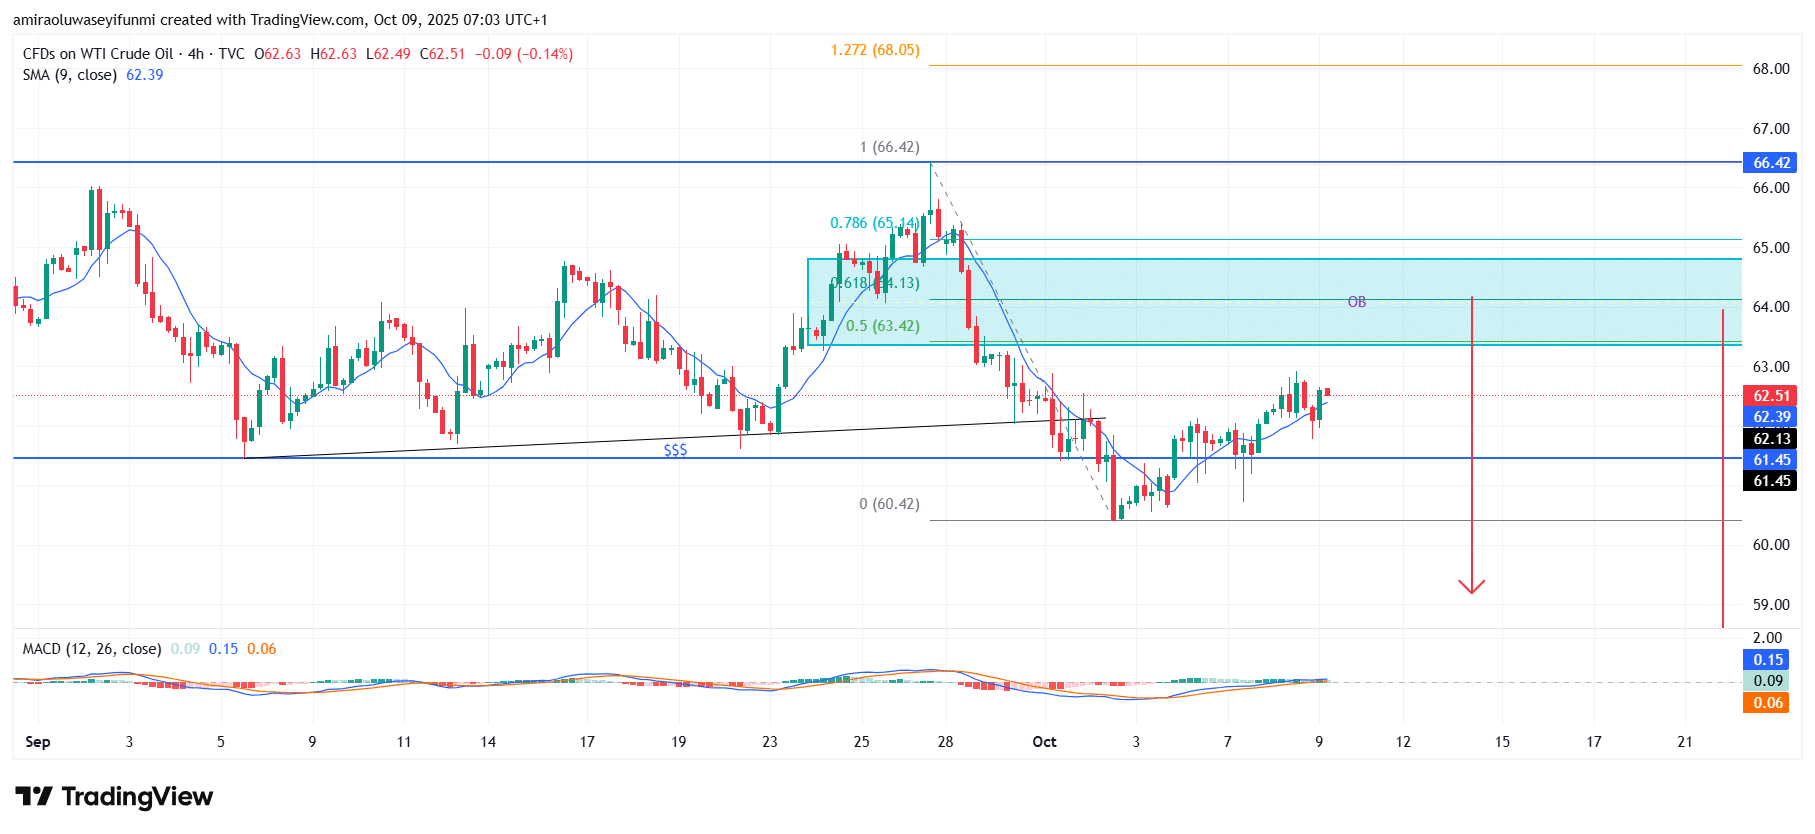
USOil Short-Term Trend: Bearish
USOil maintains a bearish structure as price continues to trade below the 9-period SMA, showing weak buying momentum. The recent retracement into the $63.40–$64.10 order block coincides with the 50–61.8% Fibonacci retracement area, suggesting a possible rejection zone.
Momentum indicators such as the MACD reflect limited bullish strength, implying exhaustion in the short-term rebound. A decisive break below $61.50 would likely confirm a renewed bearish continuation toward the $60.00 region.
Make money without lifting your fingers: Start using a world-class auto trading solution
How To Buy Lucky Block
Note: Learn2.trade is not a financial advisor. Do your research before investing your funds in any financial asset, product, or event. We are not responsible for your investment results.
- Broker
- Min Deposit
- Score
- Visit Broker

- Award-winning Cryptocurrency trading platform
- $100 minimum deposit,
- FCA & Cysec regulated

- 20% welcome bonus of upto $10,000
- Minimum deposit $100
- Verify your account before the bonus is credited
- Fund Moneta Markets account with a minimum of $250
- Opt in using the form to claim your 50% deposit bonus
Learn to Trade
Never Miss A Trade Again

Signal Notification
Real-time signal notifications whenever a signal is opened, closes or Updated

Get Alerts
Immediate alerts to your email and mobile phone.

Entry Price Levels
Entry price level for every signal Just choose one of our Top Brokers in the list above to get all this free.