

Market Analysis – March 21
USOil remains under pressure as sellers continue to dominate the price action. The 9-day Simple Moving Average (SMA) at $67.250 serves as dynamic resistance, hindering any upward movement. The MACD (Moving Average Convergence Divergence) indicator reflects weak bullish momentum, with the MACD line positioned below the signal line, reinforcing a bearish outlook. This indicates that the recent price recovery lacks sufficient strength, and further declines are probable unless momentum improves.
USOil Key Levels
Resistance Levels: $77.260, $80.730, $84.490
Support Levels: $67.070, $65.290, $61.760
USOil Long-Term Trend: Bearish
The price action outlines a distinct descending trendline, indicating lower highs and continued bearish pressure. A recent attempt to break above the $68.290 level was unsuccessful, reinforcing the prevailing downward trajectory. Support levels at $67.070 and $65.290 remain critical, and a breach of these points could lead to further losses.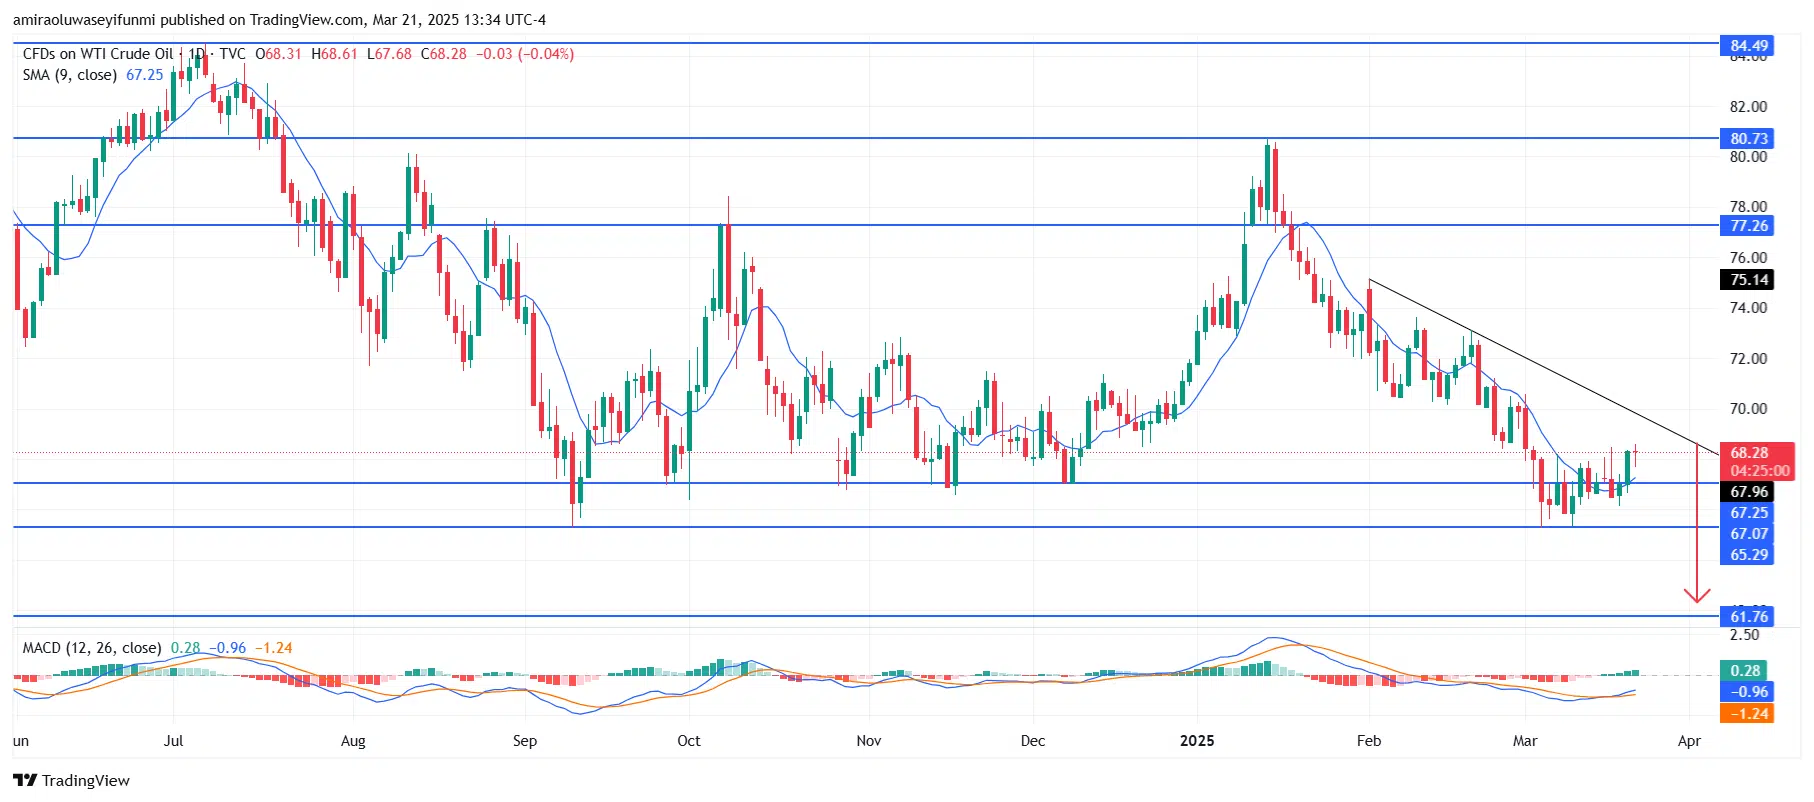
USOil Short-Term Trend: Bearish
Make money without lifting your fingers: Start using a world-class auto trading solution
How To Buy Lucky Block
Note: Learn2.trade is not a financial advisor. Do your research before investing your funds in any financial asset, product, or event. We are not responsible for your investment results.


