

Lucky Block Price Forecast – Expert Analysis & Trading Tips | Learn 2 Trade – Expert Analysis & Trading Tips | Learn 2 Trade – March 26th
Lucky Block price forecast indicates that the market is presently witnessing a notable and significant surge in buying activity. This uptick in buying pressure signals a potential shift in investor sentiment.
LBLOCKUSD Long-Term Trend: Bullish Key Levels
Support Level: $0.00000870, $0.00000940
Resistance Level: $0.00001250, $0.00002300
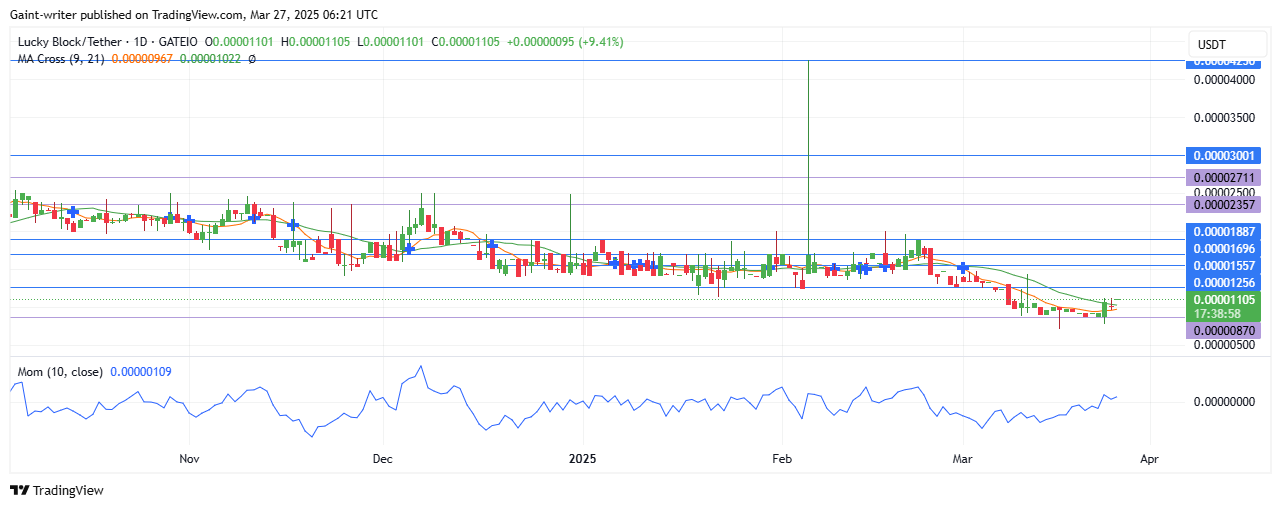 Lucky Block Long-Term Trend: Bullish (Daily Chart)
The recovery from the $0.00000870 area marks the beginning of a positive buying atmosphere in the market. As March draws to a close, the sell strength appears to be fading. The sellers who have dominated for months may struggle to maintain their influence in the LBLOCKUSD market.
LBLOCK Price Forecast – LBLOCKUSD Outlook
On the big time frame, sellers have been relatively quiet as buyers continue to make their presence felt. While the pace of buying may still be gradual, it is enough to push prices higher.
The Moving Average Crossing highlights the likelihood of sustained bullish momentum. This reinforces the expectation that buyers are preparing to challenge the $0.00001250 resistance level.
 LBLOCK Medium-Term: Bullish (4-hour chart)
The outlook for Lucky Block remains highly favourable as buyers refuse to pull out and continue to build pressure. If the current trend persists, there is a strong possibility that the market will see prices break through the $0.00001250 resistance level.
Traders should closely monitor the performance of the Momentum indicator and Moving Average Crossing for any signs of strengthening bullish sentiment. As buyers prepare for further upward movement, the potential for continued gains in the Lucky Block market looks promising.
How To Buy Lucky Block
Note: Learn2.trade is not a financial advisor. Do your research before investing your funds in any financial asset, product, or event. We are not responsible for your investment results.


