Don’t invest unless you’re prepared to lose all the money you invest. This is a high-risk investment and you are unlikely to be protected if something goes wrong. Take 2 minutes to learn more
Lucky Block – Guide, Tips & Insights | Learn 2 Trade price forecast is currently experiencing a robust surge in buying activity as bulls take charge from the $0.00000870 key area.
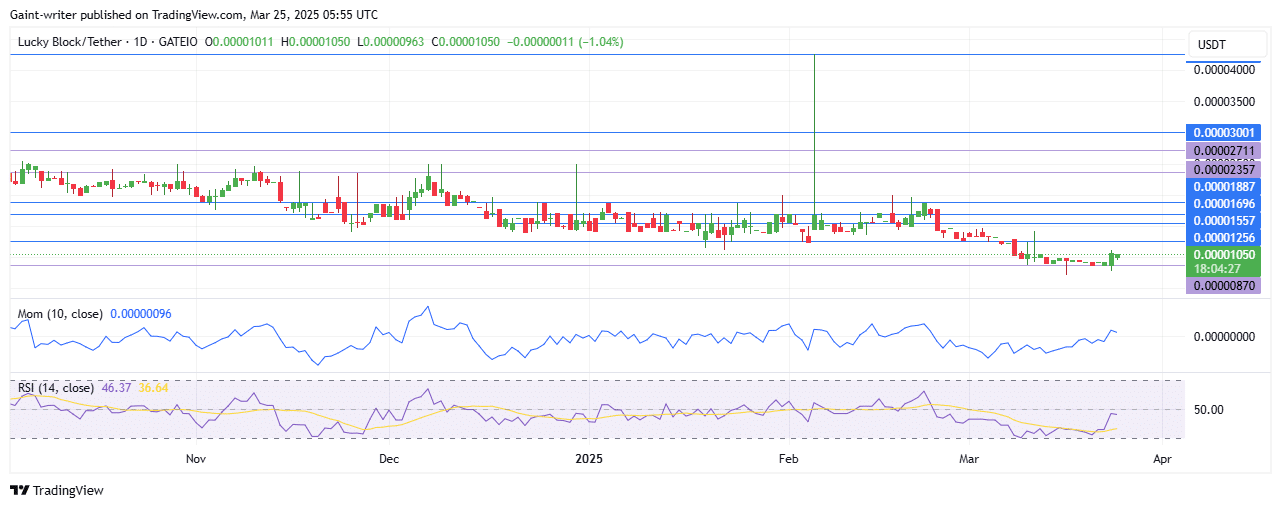
LBLOCKUSD Key Levels
Support Level: $0.00000870, $0.00000970 Resistance Level: $0.00001560, $0.00002200
Lucky Block – Guide, Tips & Insights | Learn 2 Trade Long Term Trend: Bullish Daily Chart
The $0.00000870 significant level has historically been a battleground for sellers, who have attempted to penetrate deeper throughout the year. However, the recent bullish stance has helped buyers reclaim control, marking a significant shift in market dynamics.
Since February, the market has been under intense pressure, but buyers have remained stimulated and are now on a recovery path. Before the recent surge, the market experienced a period of struggle that led to accumulation above the $0.00000870 key area. The bulls managed to cross through the $0.00001270 zone, pushing prices close to the significant $0.00001560 level.
After a brief pullback, the bulls are now re-emerging, signaling a resurgence in the market. The daily chart reflects strong upward momentum, with key indicators supporting the bullish sentiment.
The Momentum indicator is responding positively to the bullish strength, indicating that buyers are gaining traction. Additionally, the RSI (Relative Strength Index) shows that sellers have weakened their trend in recent days, further reinforcing the bullish outlook. On the daily time frame, buyers are firmly in control, successfully putting sellers out of the way. With the current momentum, buyers appear well-positioned to continue their upward trajectory in the market.
LBLOCK Medium-Term Trend: Bullish (4-hour chart)
The outlook for Lucky Block – Guide, Tips & Insights | Learn 2 Trade remains highly optimistic as buyers continue to accelerate their pace. If the current trend persists and buying momentum strengthens, there could be a strong possibility for prices to test the $0.00001560 resistance level.
Traders should monitor the behavior of the Momentum indicator and RSI for signs of potential trend reversals. As buyers aim to spread their wings higher, the potential for further gains in the Lucky Block – Guide, Tips & Insights | Learn 2 Trade market looks promising.
Note: Learn2.trade is not a financial advisor. Do your research before investing your funds in any financial asset, product, or event. We are not responsible for your investment results.
Trade on MT4 with Leverage up to 1:500! Trade on MT4 with Leverage up to 1:500!
X
We use cookies to ensure that we give you the best experience on our website. If you continue to use this site we will assume that you are happy with it.

 LBLOCK Medium-Term Trend: Bullish (4-hour chart)
 LBLOCK Medium-Term Trend: Bullish (4-hour chart)


