

NAS100 Analysis – March 23
NAS100 is showing signs of a bullish recovery from a key support level. The 9-day SMA currently stands at $19,670, and the price is trading above it, indicating a short-term bullish trend. The RSI is at 45 and gradually rising from the oversold zone, suggesting increasing buying pressure. If the RSI moves above 50, it could confirm stronger bullish momentum and indicate a potential continuation of the upward move.
NAS100 Key Levels
Resistance Levels: $20,650, $22,140, $23,000
Support Levels: $19,200, $18,320, $17,250
NAS100 Long-Term Trend: Bullish
The price recently rebounded from the $18,800 order block, a significant demand zone that offered strong support. It is now moving toward the $20,290 Fibonacci 0.5 retracement level, which may act as resistance. A breakout above this point could clear the way toward the next major resistance at $20,650, where sellers are expected to be active.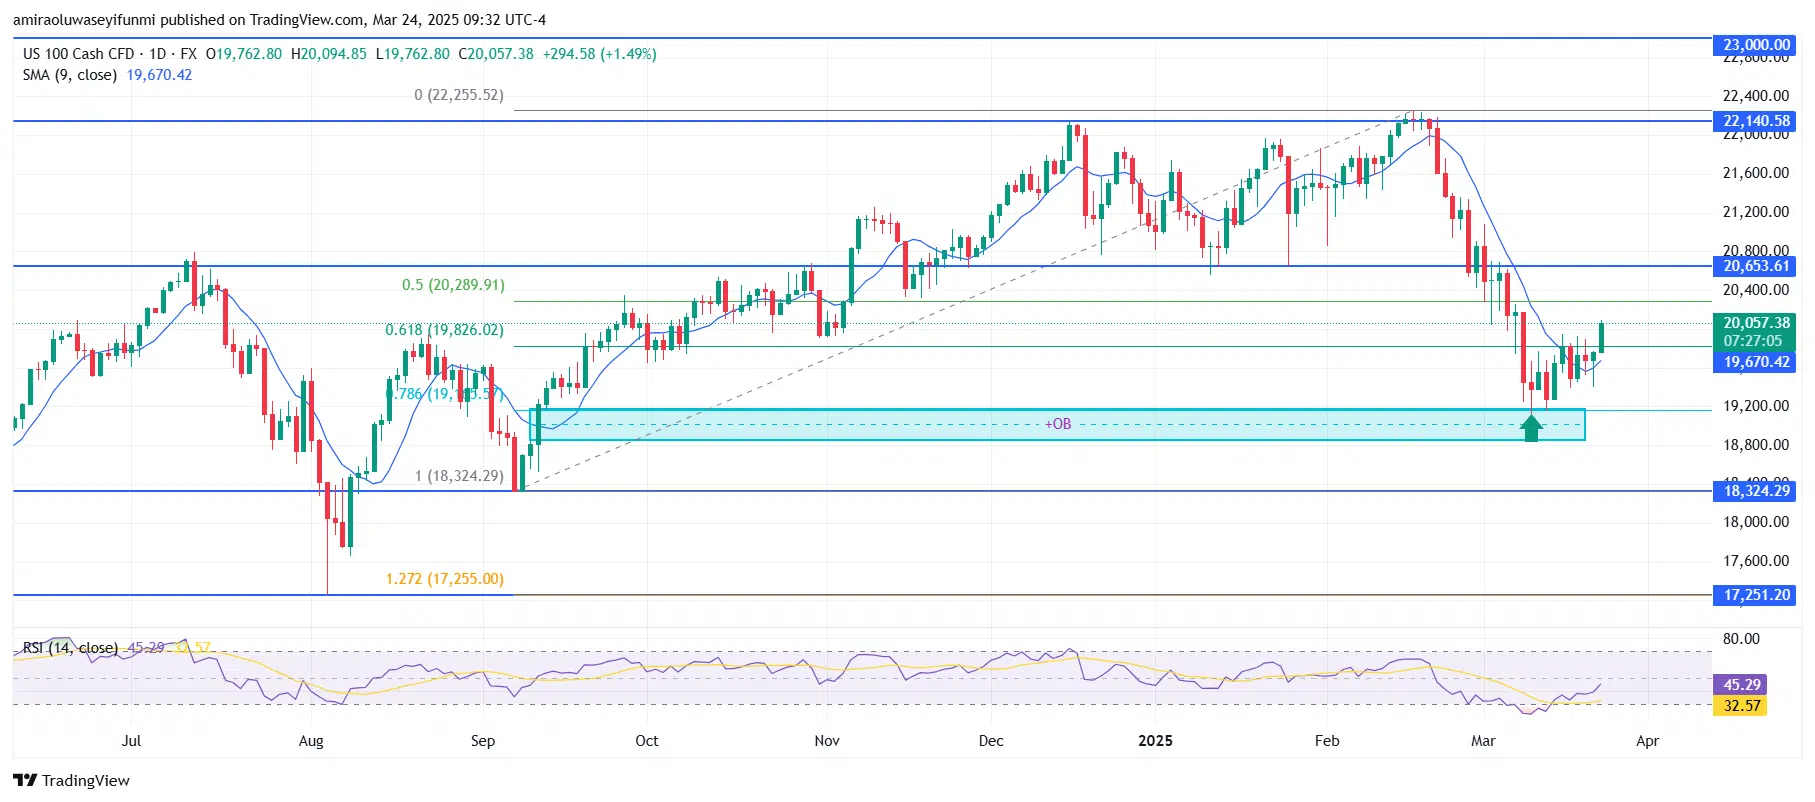
NAS100 Short-Term Trend: Bullish
Make money without lifting your fingers: Start using a world-class auto trading solution
How To Buy Lucky Block
Note: Learn2.trade is not a financial advisor. Do your research before investing your funds in any financial asset, product, or event. We are not responsible for your investment results.


