Market Analysis – March 7
USOil remains under bearish pressure as lower highs and lower lows continue to form. The 9-period SMA (Simple Moving Average) is positioned at $68.580, acting as dynamic resistance and keeping price action below it. The MACD (Moving Average Convergence Divergence) remains deep in bearish territory, with both the MACD line (-0.44) and the signal line (-1.49) reflecting strong downward momentum. This suggests that selling pressure is dominant, with no signs of bullish divergence emerging yet. Without a significant increase in buying volume, momentum continues to favor the bears.
USOil Key Levels
Resistance Levels: $77.260, $84.490, $87.600
Support Levels: $67.100, $65.300, $61.760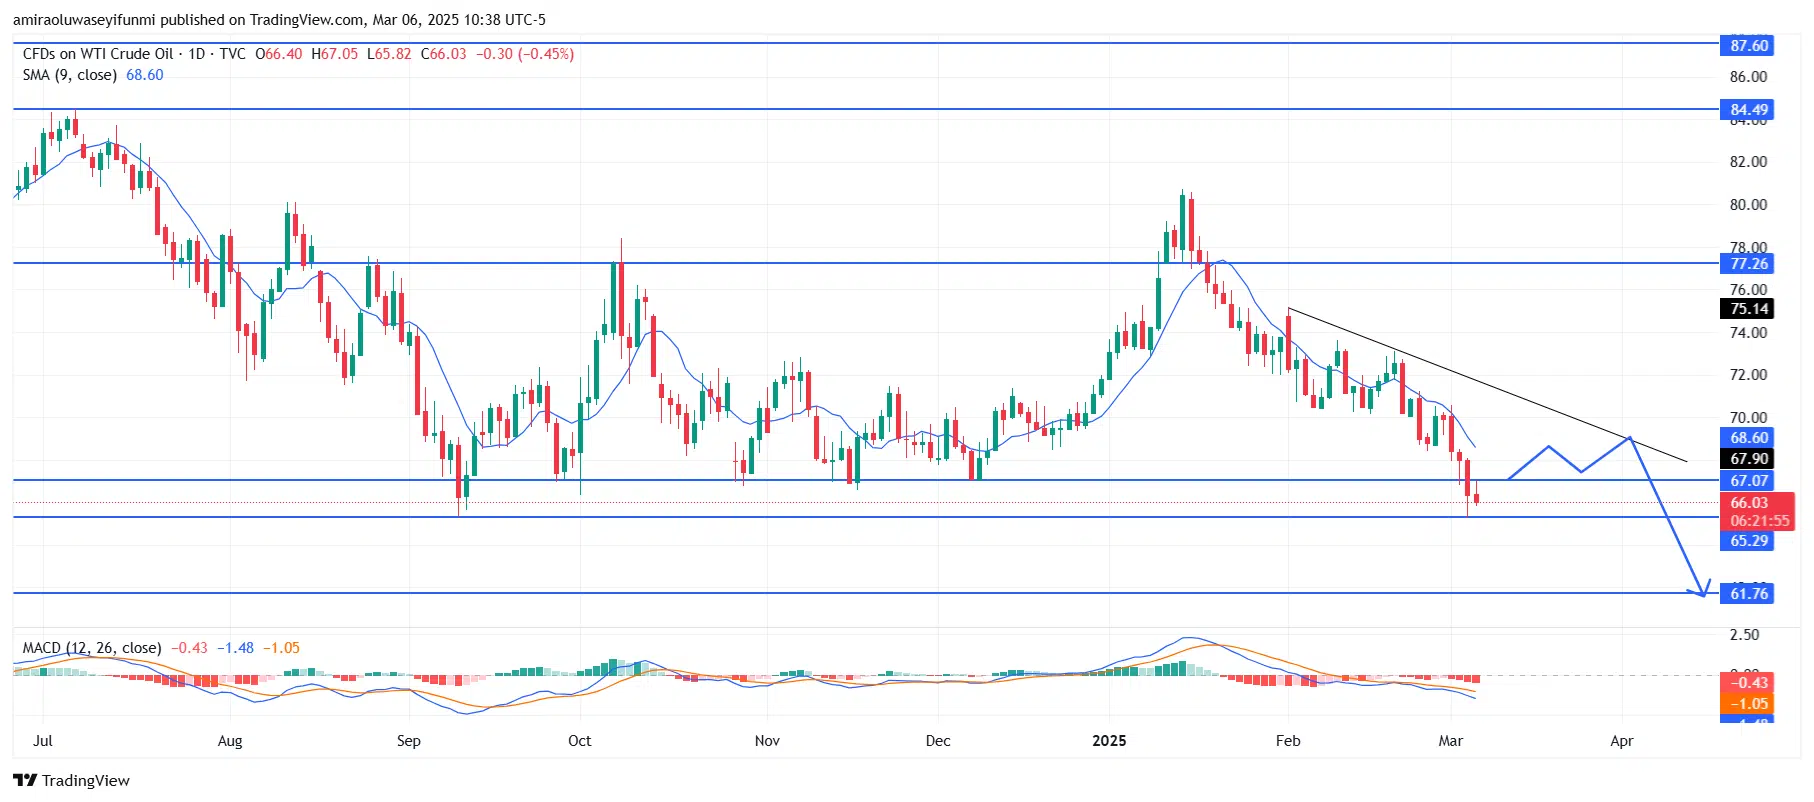
USOil Long-Term Trend: Bearish
Price action indicates a consistent downtrend, characterized by lower highs and lower lows, respecting a descending trendline. The key resistance zone is around $68.580–$67.900, which previously served as support but has now turned into resistance. The price is currently testing the $67.070–$65.290 support zone, with bearish candles forming below this level. If the price fails to reclaim the trendline or break above the SMA, further downside movement is expected.
Given the prevailing bearish structure, USOil is likely to retest the trendline as it continues its downward trajectory. If sellers maintain control, the next major target is $61.760, a critical support level. Any short-term bounce will likely face rejection at the diagonal resistance. Overall, the market remains in a strong downtrend, reinforcing the potential for further declines.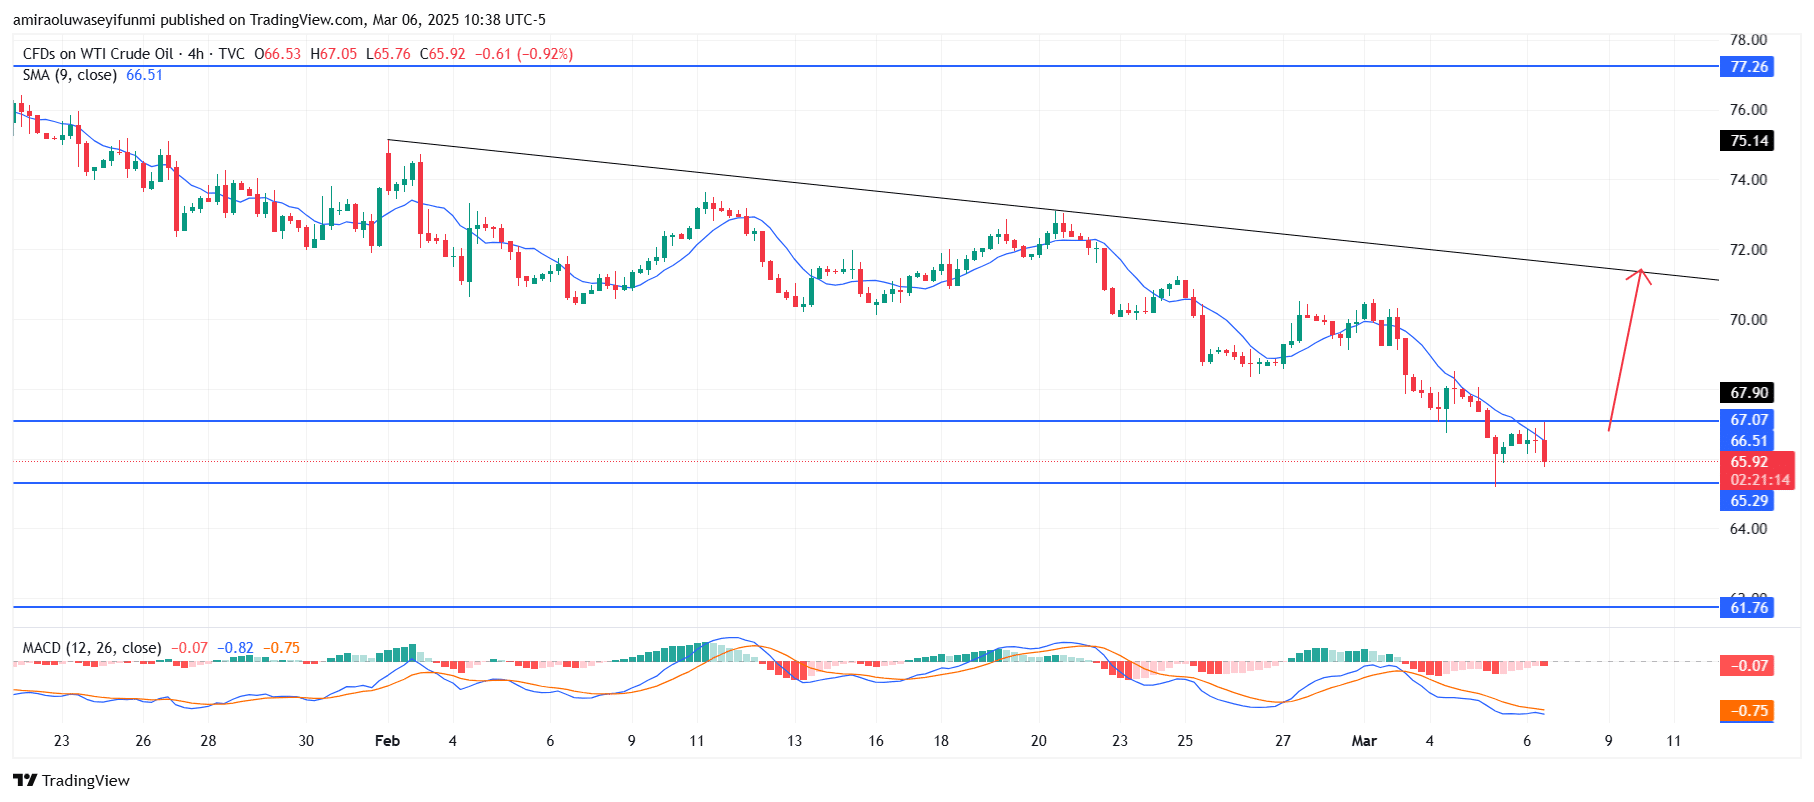
USOil Short-Term Trend: Bullish
The 9-period SMA at $66.520 is acting as dynamic resistance, yet price is showing signs of recovery above the $65.290 support level. The MACD histogram is becoming lighter, signaling weakening bearish momentum, while the signal line is flattening out. A successful pullback could initiate a bullish move toward the descending trendline near $72.00. Additionally, traders may consider forex signals to identify potential market opportunities. If buyers sustain momentum, prices could challenge higher resistance zones, confirming a short-term bullish reversal.
Make money without lifting your fingers: Start using a world-class auto trading solution
How To Buy Lucky Block – Guide, Tips & Insights | Learn 2 Trade
Note: Learn2.trade is not a financial advisor. Do your research before investing your funds in any financial asset, product, or event. We are not responsible for your investment results.
- Broker
- Min Deposit
- Score
- Visit Broker

- Award-winning Cryptocurrency trading platform
- $100 minimum deposit,
- FCA & Cysec regulated

- 20% welcome bonus of upto $10,000
- Minimum deposit $100
- Verify your account before the bonus is credited
- Fund Moneta Markets account with a minimum of $250
- Opt in using the form to claim your 50% deposit bonus
Learn to Trade
Never Miss A Trade Again

Signal Notification
Real-time signal notifications whenever a signal is opened, closes or Updated

Get Alerts
Immediate alerts to your email and mobile phone.

Entry Price Levels
Entry price level for every signal Just choose one of our Top Brokers in the list above to get all this free.