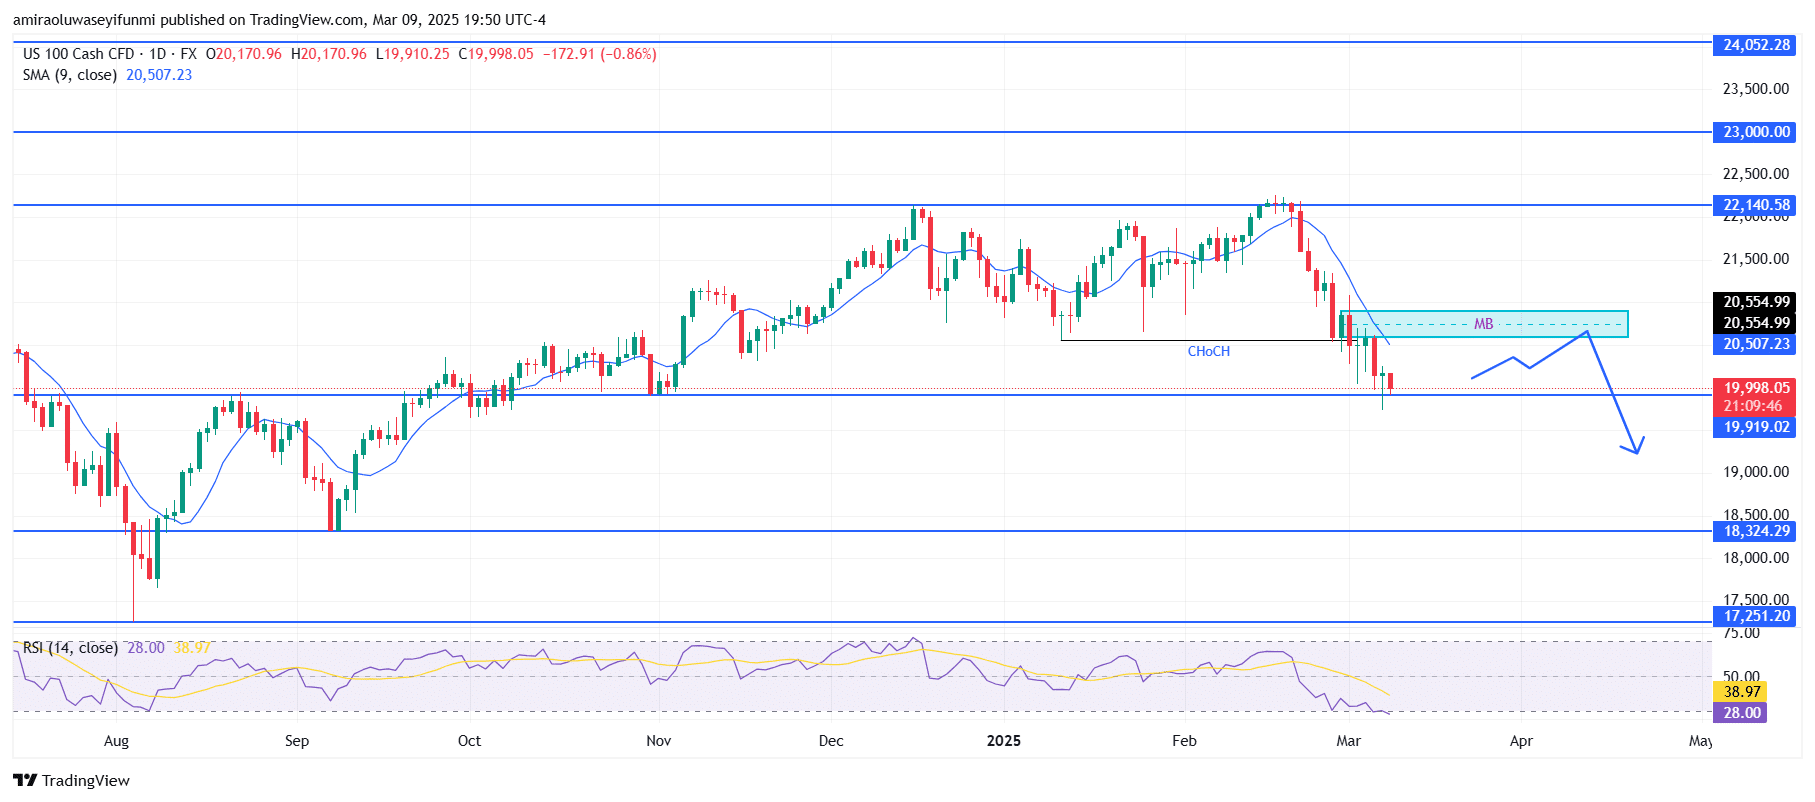
NAS100 overall trend remains bearish despite being in an oversold state. The index is trading below the 9-day Simple Moving Average (SMA) at approximately $20,510, confirming short-term bearish momentum. The Relative Strength Index (RSI) is around 28, indicating oversold conditions, which suggests a potential short-term pullback before further downside movement. The RSI previously reacted near the 50-level, reinforcing the strength of the downtrend. While a minor relief rally could occur, overall sentiment remains bearish.
NAS100 Key Levels
Resistance Levels: $22,140, $23,000, $24,050 Support Levels: $19,920, $18,320, $17,250
NAS100 Long-Term Trend: Bearish
Price action indicates a clear Change of Character (CHoCH), confirming a bearish shift. The break below the key support zone around $20,510 signals strong selling pressure. The recent decline tested $19,920, a crucial support area. A bearish order block (Mitigation Block—MB) has formed around $20,550, acting as a potential resistance zone if the price retraces. Given the current market structure, any bullish move toward this area is likely to encounter renewed selling pressure.
The prevailing trend suggests a bearish continuation. If NAS100 fails to reclaim $20,550, it is expected to continue its downtrend toward the next major support at $18,320. If bearish momentum persists, the next potential target is $17,250. However, a short-term bounce into the $20,550 zone before further decline remains possible. Traders relying on forex signals may find confirmation in price action around these levels before making new entries.
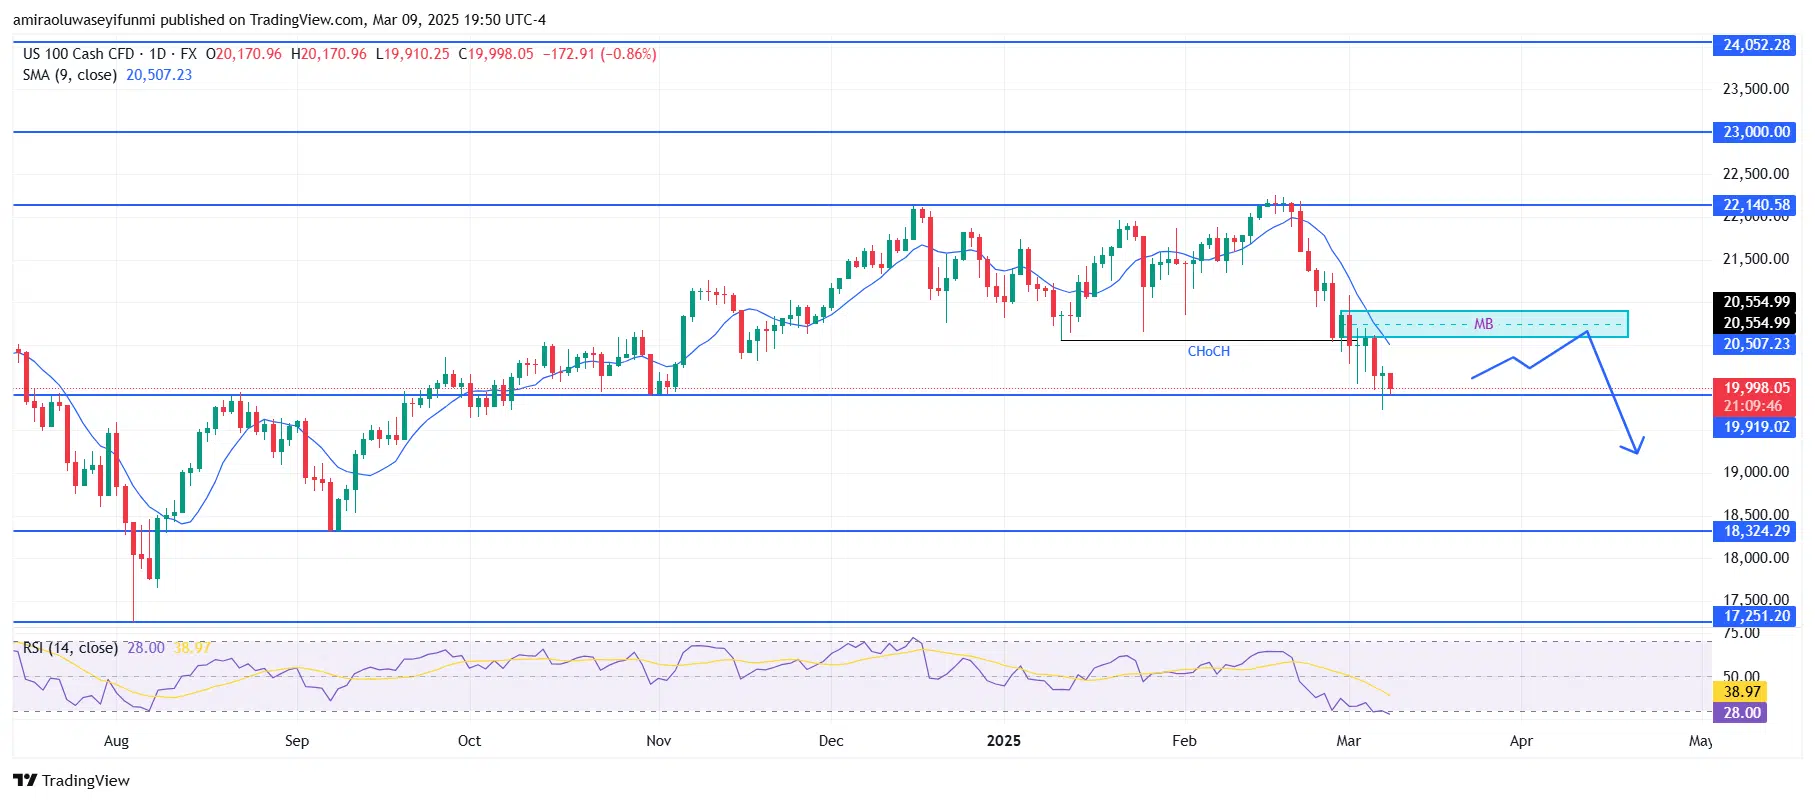
NAS100 Short-Term Trend: Bullish
NAS100 is attempting to break above a descending trendline, indicating a potential bullish reversal. The 9-period Simple Moving Average (SMA) at approximately $20,120 is within reach, and a sustained move above it could confirm upside momentum.
The Relative Strength Index (RSI) is recovering from oversold levels, currently around 34, suggesting a possible shift in sentiment. A breakout above $20,550 could trigger further bullish movement toward $21,340.
Note: Learn2.trade is not a financial advisor. Do your research before investing your funds in any financial asset, product, or event. We are not responsible for your investment results.
Trade on MT4 with Leverage up to 1:500! Trade on MT4 with Leverage up to 1:500!
X
We use cookies to ensure that we give you the best experience on our website. If you continue to use this site we will assume that you are happy with it.