Key Resistance Levels: $66.00, $70.00, $74.00
Key Support Levels: $48.00,$44.00,$40.00
USOIL (WTI) Long-term Trend: Bullish
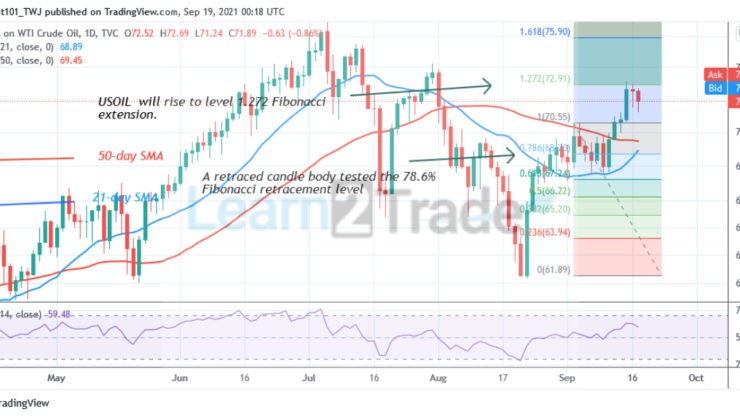
USOIL has been in an upward move. The index has reached the high of level $73.11 but faces resistance at the recent high. In the previous price action, WTI reached a high of $74 but faces stiff rejection. The market dropped sharply to the low of $61.50. Meanwhile, on September 2 uptrend; a retraced candle body tested the 78.6% Fibonacci retracement level. The retracement indicates that USOIL will rise but reverse at level 1.272 Fibonacci extension. From the price action, the index has resumed its downward move.
Daily Chart Indicators Reading:
USOIL is at level 59 of the Relative Strength period 14. It indicates that the market is in the uptrend zone and above the centerline 50. The 21-day and the 50-day SMA are sloping upward
indicating the uptrend. The crypto’s price is above the 21-day
and the 50-day SMA which indicates a possible rise.
USOIL (WTI) Medium-term bias: Bullish
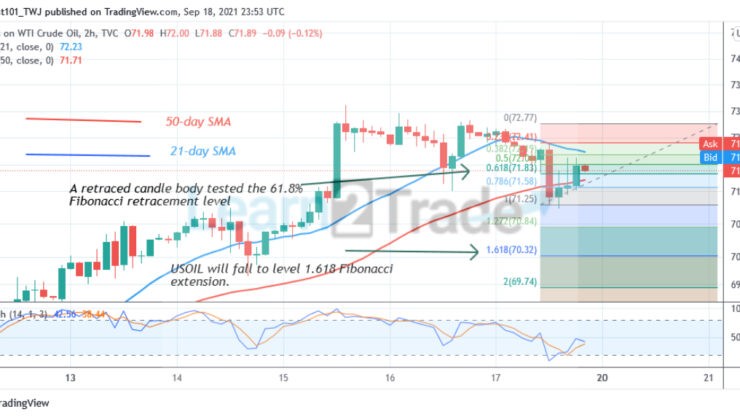
On the 4-hour chart, the index is in a sideways move. Since September 15, USOIL reached the high of level $73 but faced resistance at the recent high. For the past four days, the index has been a sideways move. Meanwhile, on September 17 downtrend; a retraced candle body tested the 61.8% Fibonacci retracement level. The retracement indicates that USOIL will fall to level 1.618 Fibonacci extension or level $70.32.
4-hour Chart Indicators Reading
USOIL is below the 50 % range of the daily stochastic. This indicates that the market is in bearish momentum. The SMAs are sloping horizontally indicating sideways move.
General Outlook for USOIL (WTI)
USOIL is in a downward move after the rejection at level $73. According to the Fibonacci tool, the USOIL will fall to level 1.618 Fibonacci extension or level $70.32.On the daily chart, the selling pressure will resume if price breaks below the moving averages.
You can purchase crypto coins here: Buy Token
Note: Learn2Trade.com is not a financial advisor. Do your research before investing your funds in any financial asset or presented product or event. We are not responsible for your investing results
- Broker
- Min Deposit
- Score
- Visit Broker

- Award-winning Cryptocurrency trading platform
- $100 minimum deposit,
- FCA & Cysec regulated

- 20% welcome bonus of upto $10,000
- Minimum deposit $100
- Verify your account before the bonus is credited
- Fund Moneta Markets account with a minimum of $250
- Opt in using the form to claim your 50% deposit bonus
Learn to Trade
Never Miss A Trade Again

Signal Notification
Real-time signal notifications whenever a signal is opened, closes or Updated

Get Alerts
Immediate alerts to your email and mobile phone.

Entry Price Levels
Entry price level for every signal Just choose one of our Top Brokers in the list above to get all this free.