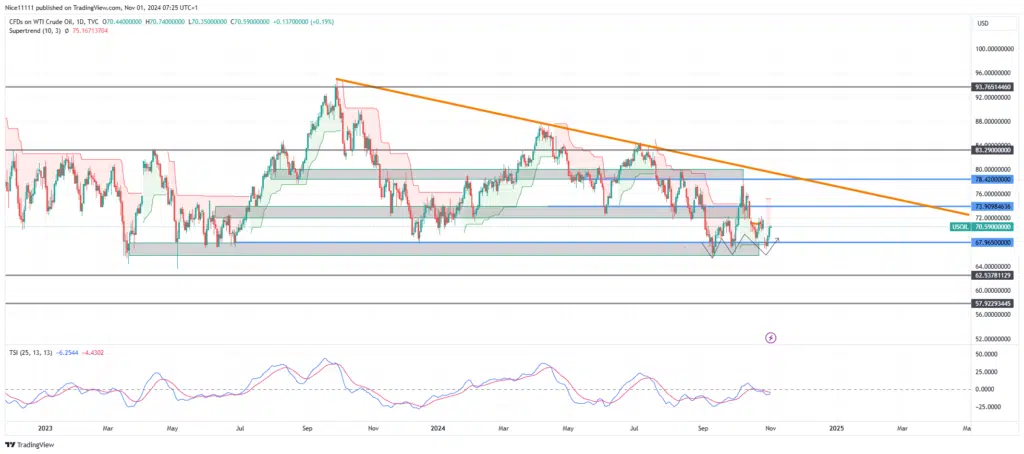
USOil index remains in a long-term bearish trend, with a downward-sloping trendline defining the daily chart. Since 2023, the key demand zone at 67.970 has held firm, forming a descending triangle pattern. Recent price action saw a gap into this zone, prompting a bounce off the demand level as the market attempts to fill this gap.
The USOil index long-term trend remains bearish, though market conditions suggest a possible breakout as price narrows within the large descending triangle pattern. The Super Trend indicator has highlighted reversals both at the descending trendline and the demand level of 67.970. A red cloud now hovers above daily candles following trendline tests, while a green cloud appears beneath candles after tests of the demand zone, hinting at potential reversals.
The True Strength Index (TSI) shows that momentum remains weak. This reflects a strong defense by buyers at the 67.970 demand zone.
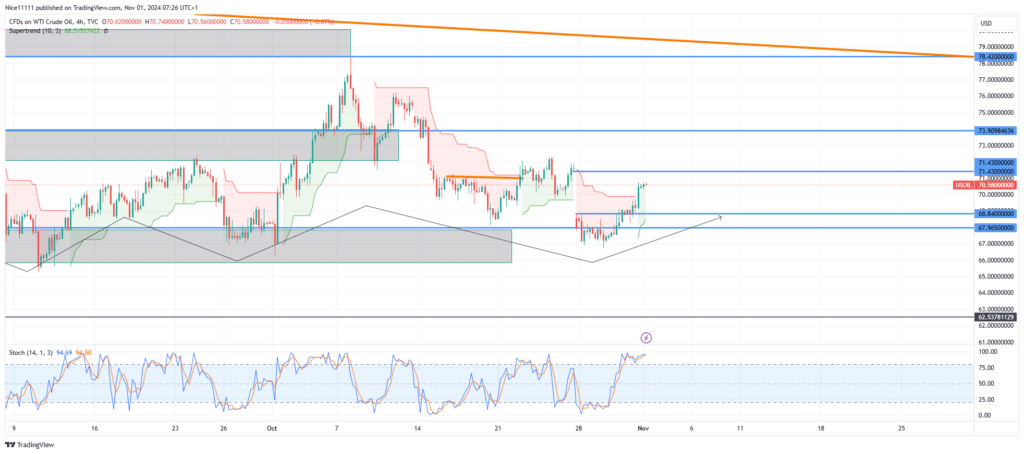
USOil Short term Trend: Bearish
On October 27, the market gapped down into the key 67.970 demand zone, where significant buying pressure led to a bounce, aiming to close the gap. A bullish structure shift on the lower timeframe could drive price action back toward the bearish trendline, creating potential opportunities within the overall bearish trend. Traders who use forex signals should take note of this.
Note: Learn2.trade is not a financial advisor. Do your research before investing your funds in any financial asset, product, or event. We are not responsible for your investment results.
Trade on MT4 with Leverage up to 1:500! Trade on MT4 with Leverage up to 1:500!
X
We use cookies to ensure that we give you the best experience on our website. If you continue to use this site we will assume that you are happy with it.