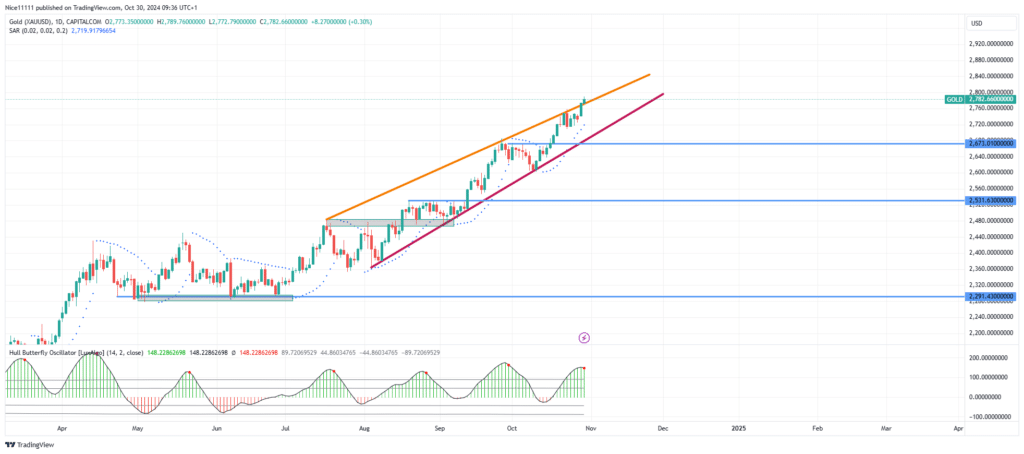
The Gold market is very bullish during this season. The market has reached a new all-time high at 2790.0. The market structure is well aligned within a bullish wedge. The price action seems to show a continuing uptrend even within the high volatility.
During the second quarter of the year, gold reached a new all-time high of 2400. The market consolidated in Q2 especially during May and June. A bullish breakout in July transformed the Gold market from a correction phase to a trending phase.
On the current uptrend, there have been series of pullbacks. Each pullback is very brief as the uptrend is strong. Each uptrend continuation through a bullish breakout has led to a new all-time high since August. The Parabolic SAR (Stop and Reverse) points are well spaced beneath the daily candles showing a strong uptrend. The Hull Butterfly indicator green bars also reveal a rising bullish momentum for Gold.
Gold Short-term trend: Bullish
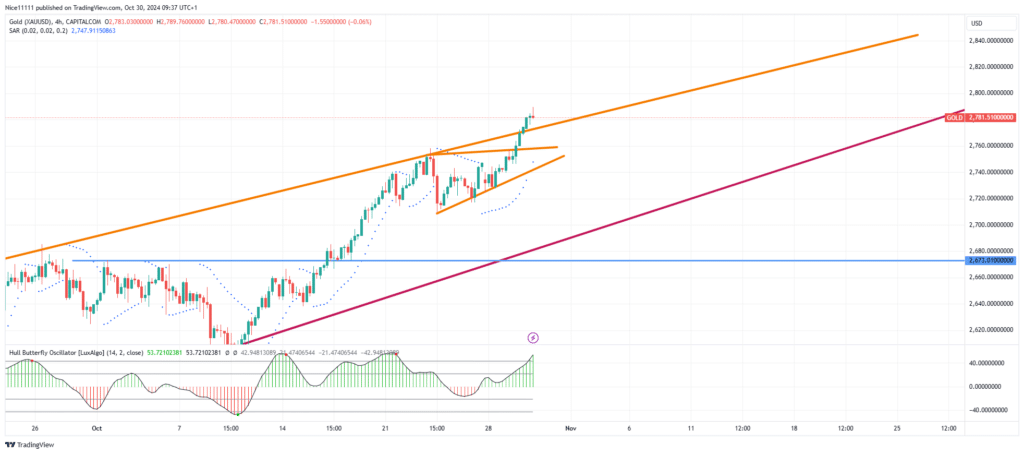
On the lower timeframe multiple breakouts from typical chart patterns are obvious. This can help traders sync with the strong upward move. The Hull Butterfly Oscillator as well as the Parabolic SAR are showing a strong uptrend with increasing momentum giving room for higher prices. The market is expected to reach 2800.0 shortly. This is expected to reflect in the best forex signals.
Note: Learn2.trade is not a financial advisor. Do your research before investing your funds in any financial asset, product, or event. We are not responsible for your investment results.
Trade on MT4 with Leverage up to 1:500! Trade on MT4 with Leverage up to 1:500!
X
We use cookies to ensure that we give you the best experience on our website. If you continue to use this site we will assume that you are happy with it.