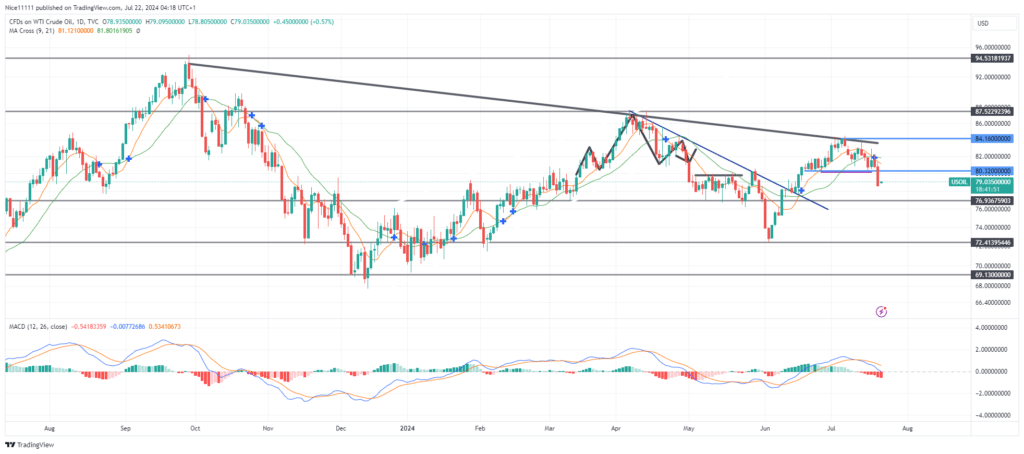
USOIL price has experienced a bearish shift in market structure, characterized by the price falling below a major swing low on the daily chart. This shift in market structure appears to be driven by a ‘three falling peaks’ pattern noticeable on both higher and lower timeframes.
USOIL price action has posted three significant lower highs on the daily chart, known as three falling peaks. Each swing high features a smaller reversal pattern. The first high, formed in September, had a double top reversal pattern. The second lower high, formed in April, featured a head and shoulders reversal pattern. The third lower high, completing the three falling peaks, features a smaller three falling peaks pattern, establishing a bearish shift in market structure.
The MACD (Moving Average Convergence and Divergence) indicator on the daily chart shows a price decline following an oversold market. Similarly, the fall of the daily candles below the Moving Average cross (Periods 9 and 21) indicates a price decline.
USOIL Short-term Trend: Bearish
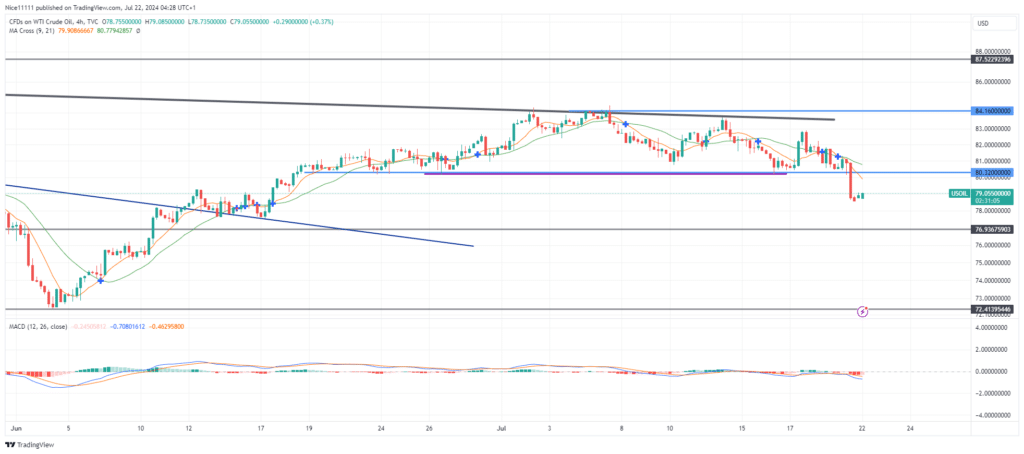
On the lower timeframe, a bearish order block rests at 81.00. A pullback to this bearish order block would be a good setup to generate the best forex signals for shorts, providing the advantage of shorting from a premium price.
Note: Learn2.trade is not a financial advisor. Do your research before investing your funds in any financial asset, product, or event. We are not responsible for your investment results.
Trade on MT4 with Leverage up to 1:500! Trade on MT4 with Leverage up to 1:500!
X
We use cookies to ensure that we give you the best experience on our website. If you continue to use this site we will assume that you are happy with it.