USDJPY – Guide, Tips & Insights | Learn 2 Trade – Guide, Tips & Insights | Learn 2 Trade currency pair has undergone a significant reversal in its daily bias. The market experienced a bearish shift after failing to sustain a pattern of higher highs. This reversal signals potential structural weakness in the bullish trend, which had been in place since September 2024.
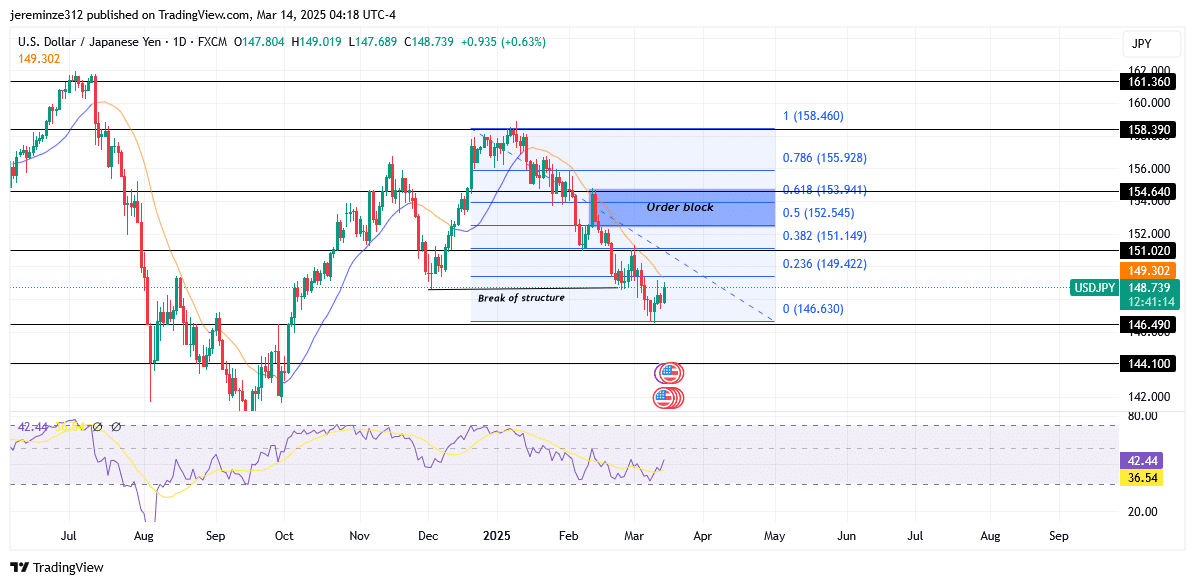
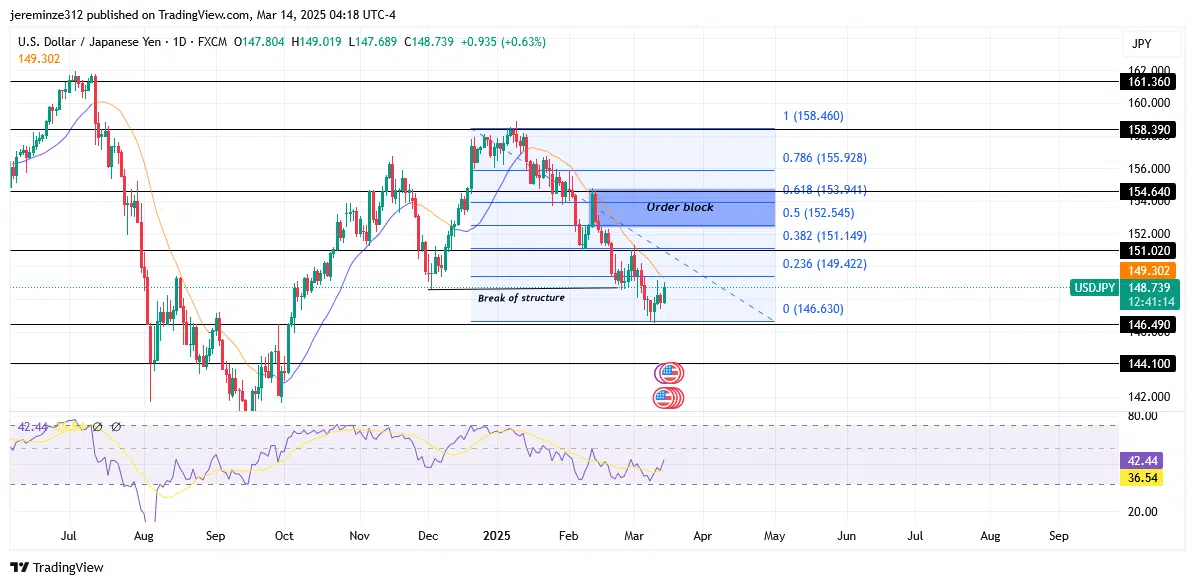
The uptrend that began in September 2024 saw a strong bullish rally. It was characterized by a series of decisive bullish candles that pushed the price past the critical 154.640 supply zone. This momentum fueled further gains, culminating in the formation of a major higher high at 158.390.
However, as price action approached this key resistance level, selling pressure intensified, leading to a significant rejection. The failure to establish a new higher high confirmed a structural shift, breaking the prevailing bullish market structure and setting the stage for a bearish correction. The daily Moving Average indicates a bearish signal, reinforcing the likelihood of further declines.
Despite the broader bearish bias on the daily timeframe, the short-term trend on the 4-hour chart suggests a corrective bullish move. Price action has formed a failed low. This is often an early sign of a temporary bullish retracement before the broader bearish trend resumes.
Currently, the market is expected to retrace towards a significant daily order block, where key Fibonacci retracement levels (0.68 and 0.5) align with this zone. This confluence strengthens the probability that the order block will act as a resistance level, potentially resuming the bearish momentum once the retracement phase is complete.
If selling pressure increases after the retracement, USDJPY – Guide, Tips & Insights | Learn 2 Trade – Guide, Tips & Insights | Learn 2 Trade could continue its bearish descent, reinforcing the shift in daily market structure.
Trade on MT4 with Leverage up to 1:500! Trade on MT4 with Leverage up to 1:500!
X
We use cookies to ensure that we give you the best experience on our website. If you continue to use this site we will assume that you are happy with it.
 USDJPY – Guide, Tips & Insights | Learn 2 Trade – Guide, Tips & Insights | Learn 2 Trade Short-Term Trend: Bullish
 USDJPY – Guide, Tips & Insights | Learn 2 Trade – Guide, Tips & Insights | Learn 2 Trade Short-Term Trend: Bullish


