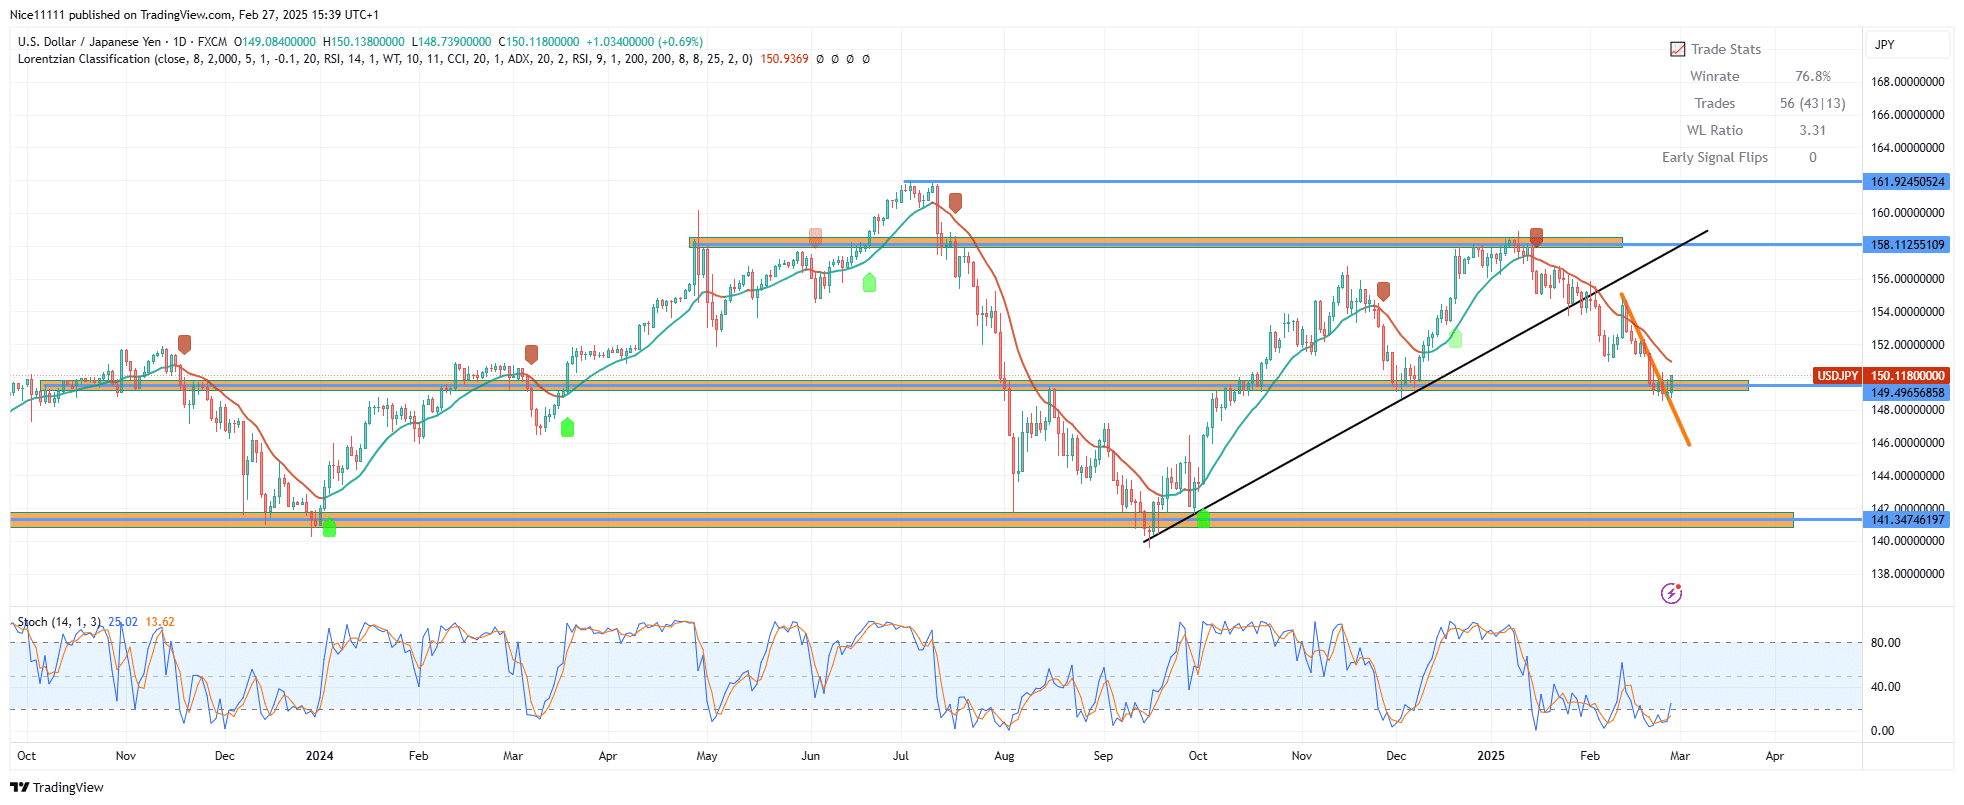
The USDJPY – Guide, Tips & Insights | Learn 2 Trade – Guide, Tips & Insights | Learn 2 Trade pair experienced a significant reversal on February 28, as bulls failed to break through the critical resistance level at 158.1130. This led to a sharp decline in price, resulting in a break of the bullish trendline. The price has now reached a crucial support level at 149.500.
The USDJPY – Guide, Tips & Insights | Learn 2 Trade – Guide, Tips & Insights | Learn 2 Trade market becomes overbought when it reaches the resistance zone of 158.1130, as indicated by the Stochastic indicator. The Smoothed Heikin Ashi red tag further confirms this, signaling a potential reversal as the price lingers at the 158.1130 level. Sellers take control, driving the price below the bullish trendline in the 24-hour timeframe.
After breaching the bullish trendline, the price declines, revealing areas of inefficiency marked by a fair value gap. The price quickly fills this gap with a pullback to a bearish order block. Upon testing the bearish order block, the price drops to the demand level of 149.500.
In the lower timeframe, the price appears to be stalling at the key level of 149.500. This could be indicative of either redistribution or accumulation. A breakout of the range formed would provide a high probability setup for the best forex signals. Traders should closely monitor the price action around this level for potential trading opportunities.
Trade on MT4 with Leverage up to 1:500! Trade on MT4 with Leverage up to 1:500!
X
We use cookies to ensure that we give you the best experience on our website. If you continue to use this site we will assume that you are happy with it.

 USDJPY – Guide, Tips & Insights | Learn 2 Trade – Guide, Tips & Insights | Learn 2 Trade


