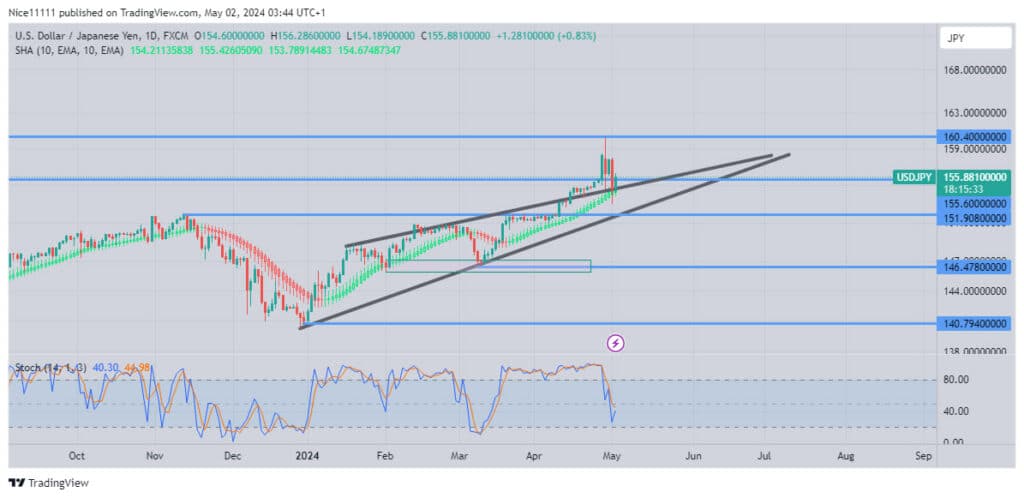
USDJPY – Guide, Tips & Insights | Learn 2 Trade – Guide, Tips & Insights | Learn 2 Trade witnessed a noteworthy development as it executed a bullish breakout from a rising wedge pattern in the twenty-four-hour timeframe, ultimately reaching the significant resistance level at 160.40 before undergoing a subsequent decline.
Analysis of the Smoothed Heikin Ashi Candles throughout the year has consistently signalled an upward trajectory, albeit with a brief deviation in early March where the price temporarily dipped below the Heikin Ashi Candles, denoted by a change in colour from green to red. Notably, the bullish momentum experienced a retracement in March, with the price testing a bullish order block situated at 146.50.
The subsequent ascent in price saw the resistance level of 151.90 breached just before the breakout beyond the confines of the rising wedge pattern on the daily chart, culminating in the attainment of the 160.40 threshold. However, following this achievement, the price retraced to the boundary of the wedge.
The observed pullback appears to be a strategic manoeuvre aimed at seeking support, with the Stochastic indicator trending towards the oversold region. Consequently, there is anticipation for a favourable bounce towards the 160.40 level, which could potentially facilitate the reinforcement of a breakout scenario.
Trade on MT4 with Leverage up to 1:500! Trade on MT4 with Leverage up to 1:500!
X
We use cookies to ensure that we give you the best experience on our website. If you continue to use this site we will assume that you are happy with it.

 USDJPY – Guide, Tips & Insights | Learn 2 Trade – Guide, Tips & Insights | Learn 2 Trade Short-Term Trend: Bearish
 USDJPY – Guide, Tips & Insights | Learn 2 Trade – Guide, Tips & Insights | Learn 2 Trade Short-Term Trend: Bearish


