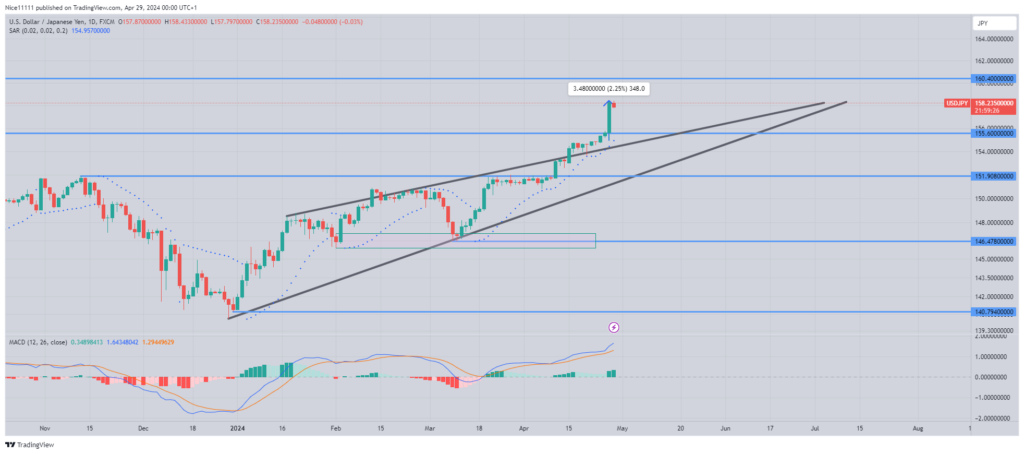
The USDJPY – Guide, Tips & Insights | Learn 2 Trade – Guide, Tips & Insights | Learn 2 Trade currency pair has recently undergone a notable bullish breakout from a rising wedge pattern observed on the daily chart. Presently, it is displaying significant momentum as it advances towards challenging the key resistance level situated at 160.40.
The bullish trajectory of USDJPY – Guide, Tips & Insights | Learn 2 Trade – Guide, Tips & Insights | Learn 2 Trade witnessed a temporary retracement during March, where the price descended to test a pivotal bullish order block positioned at 146.50. Subsequently, the Parabolic SAR (Stop and Reverse) indicator found its position beneath the daily candlesticks, guiding the price action upwards. Furthermore, the MACD histogram transitioned into green bars, signalling a strengthening uptrend.
Breaking through the resistance barrier at 151.90, the price swiftly transcended the confines of the rising wedge pattern delineated on the daily chart. Following this breakout, the rising wedge’s resilience was tested with a Pinocchio bar, revealing considerable buying pressure in the market.
The last daily candle exhibited a notable range between its lowest and highest points, registering a difference of 348 pips. This demonstrates a pronounced price inclination to traverse swiftly towards the subsequent trading zone. Currently, indicators continue to underscore a prevailing bullish bias to support bullish forex signals. The price trajectory converges towards the critical resistance level of 160.40.
Trade on MT4 with Leverage up to 1:500! Trade on MT4 with Leverage up to 1:500!
X
We use cookies to ensure that we give you the best experience on our website. If you continue to use this site we will assume that you are happy with it.

 Short-Term Trend for USDJPY – Guide, Tips & Insights | Learn 2 Trade – Guide, Tips & Insights | Learn 2 Trade: Bearish
 Short-Term Trend for USDJPY – Guide, Tips & Insights | Learn 2 Trade – Guide, Tips & Insights | Learn 2 Trade: Bearish


