USDJPY – Guide, Tips & Insights | Learn 2 Trade – Guide, Tips & Insights | Learn 2 Trade currently finds itself in a correction phase, following a pause in the recent price descent upon reaching the demand level at 142.660. The retracement has displayed lethargic price movement, characteristic of a market correction. Currently, price action is inching towards the supply zone at 151.940.
For the first half of the year, daily candles remained above the midline of the Bollinger Bands, indicating a bullish trend. However, the break of this bullish trendline in July marked a shift. Since then, all daily candles have consistently closed below the midline of the Bollinger Bands, signalling a dominant bearish trend.
The recent decline paused at the demand level of 142.660, where the Stochastic indicator revealed an oversold condition. This pause has transitioned into a correction phase, with price attempts to ascend being resisted by the moving average strand that runs between the Bollinger Bands.
On the four-hour chart, the reason for the stalled ascent becomes clearer. Price movement has encountered a bearish order block acting as a resistance. This blockage is already delaying the rise towards the higher timeframe resistance zone at 151.940. If the bearish order block holds, USDJPY – Guide, Tips & Insights | Learn 2 Trade – Guide, Tips & Insights | Learn 2 Trade may continue its bearish trend without reaching the higher timeframe supply zone.
Trade on MT4 with Leverage up to 1:500! Trade on MT4 with Leverage up to 1:500!
X
We use cookies to ensure that we give you the best experience on our website. If you continue to use this site we will assume that you are happy with it.

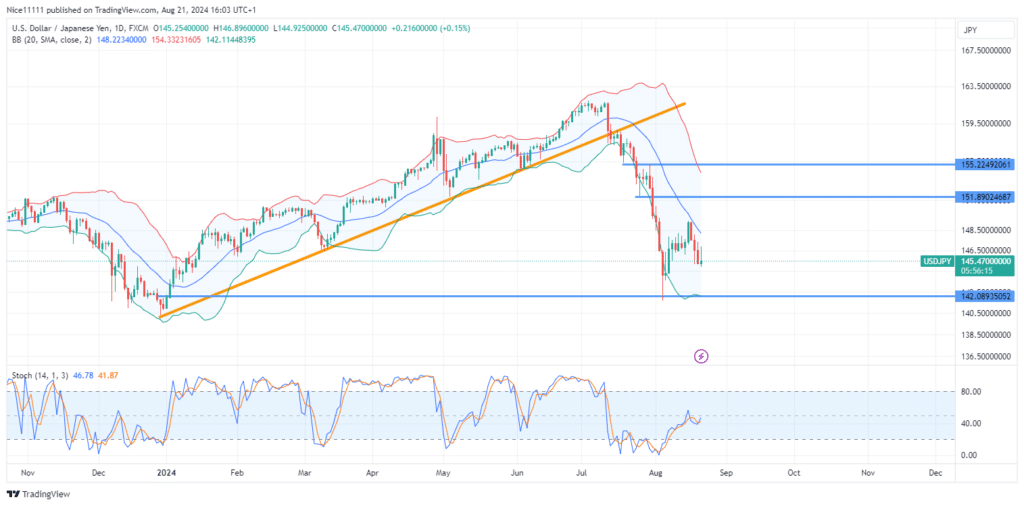
 USDJPY – Guide, Tips & Insights | Learn 2 Trade – Guide, Tips & Insights | Learn 2 Trade Short-Term Trend: Bearish
 USDJPY – Guide, Tips & Insights | Learn 2 Trade – Guide, Tips & Insights | Learn 2 Trade Short-Term Trend: Bearish


