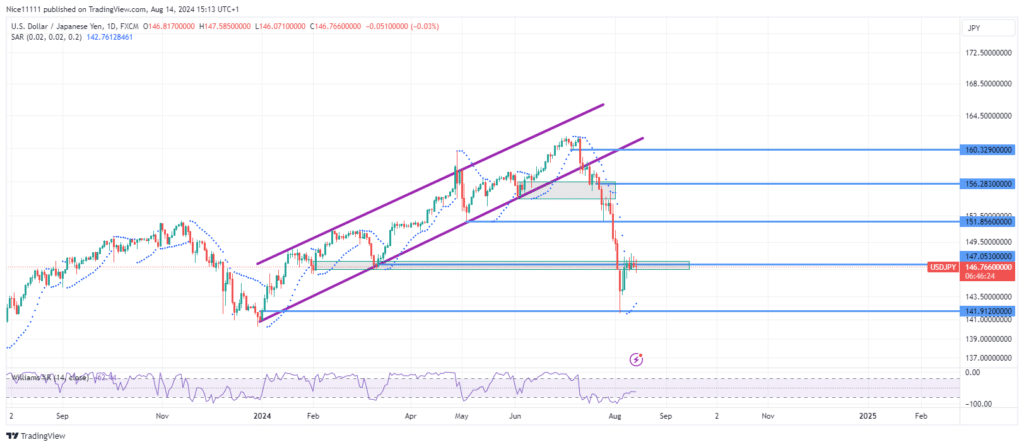
The USDJPY – Guide, Tips & Insights | Learn 2 Trade – Guide, Tips & Insights | Learn 2 Trade price decline has paused for the third time in the ongoing bearish swing. This downward movement has almost fully retraced the gains from the uptrend observed in the first half of the year, and currently, no strong indicators are suggesting an imminent reversal.
On the daily chart, the Williams Percent Range indicator signalled an oversold condition when the price tested the support level at 141.90. This oversold signal often precedes a potential upward movement. Following this, the Parabolic SAR (Stop and Reverse) indicator placed its points below the daily candles, indicating the possibility of a short-term ascent.
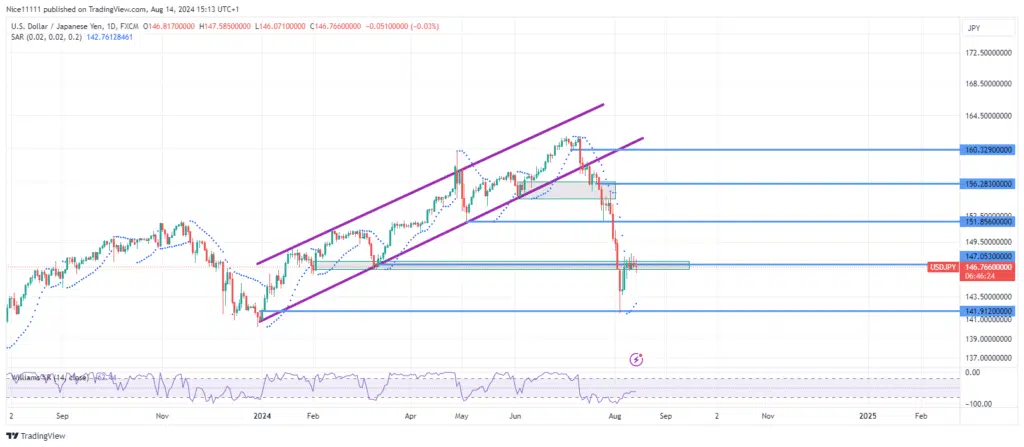
This upward movement constitutes a bullish retracement within the broader bearish trend. The pullback has encountered resistance at the key level of 147.10. Previously, this level served as support during the bullish phase. Currently, it acts as resistance, effectively capping the recent upward movement.
In the short term, the market structure on the 4-hour chart displays characteristics of price stagnation, with equal highs and higher lows indicating a ranging pattern. This pattern suggests that price action is currently consolidating rather than trending strongly in either direction.
A bullish order block, located just above the resistance zone of 147.10, may come into play. This order block could offset short positions, especially if the price attempts to move against the recent swing low at 141.90. Traders should monitor this area closely for potential trading opportunities or adjustments to their positions in response to evolving market conditions.
Trade on MT4 with Leverage up to 1:500! Trade on MT4 with Leverage up to 1:500!
X
We use cookies to ensure that we give you the best experience on our website. If you continue to use this site we will assume that you are happy with it.
 USDJPY – Guide, Tips & Insights | Learn 2 Trade – Guide, Tips & Insights | Learn 2 Trade Short-Term Trend: Ranging
 USDJPY – Guide, Tips & Insights | Learn 2 Trade – Guide, Tips & Insights | Learn 2 Trade Short-Term Trend: Ranging


