The USDJPY – Guide, Tips & Insights | Learn 2 Trade – Guide, Tips & Insights | Learn 2 Trade market is firmly locked in consolidation, reflecting deep market indecision. Price action remains confined within a tight, well-defined range, highlighting a stalemate between buyers and sellers. Neither side shows clear conviction, and the market waits for a fundamental catalyst to spark the next move.
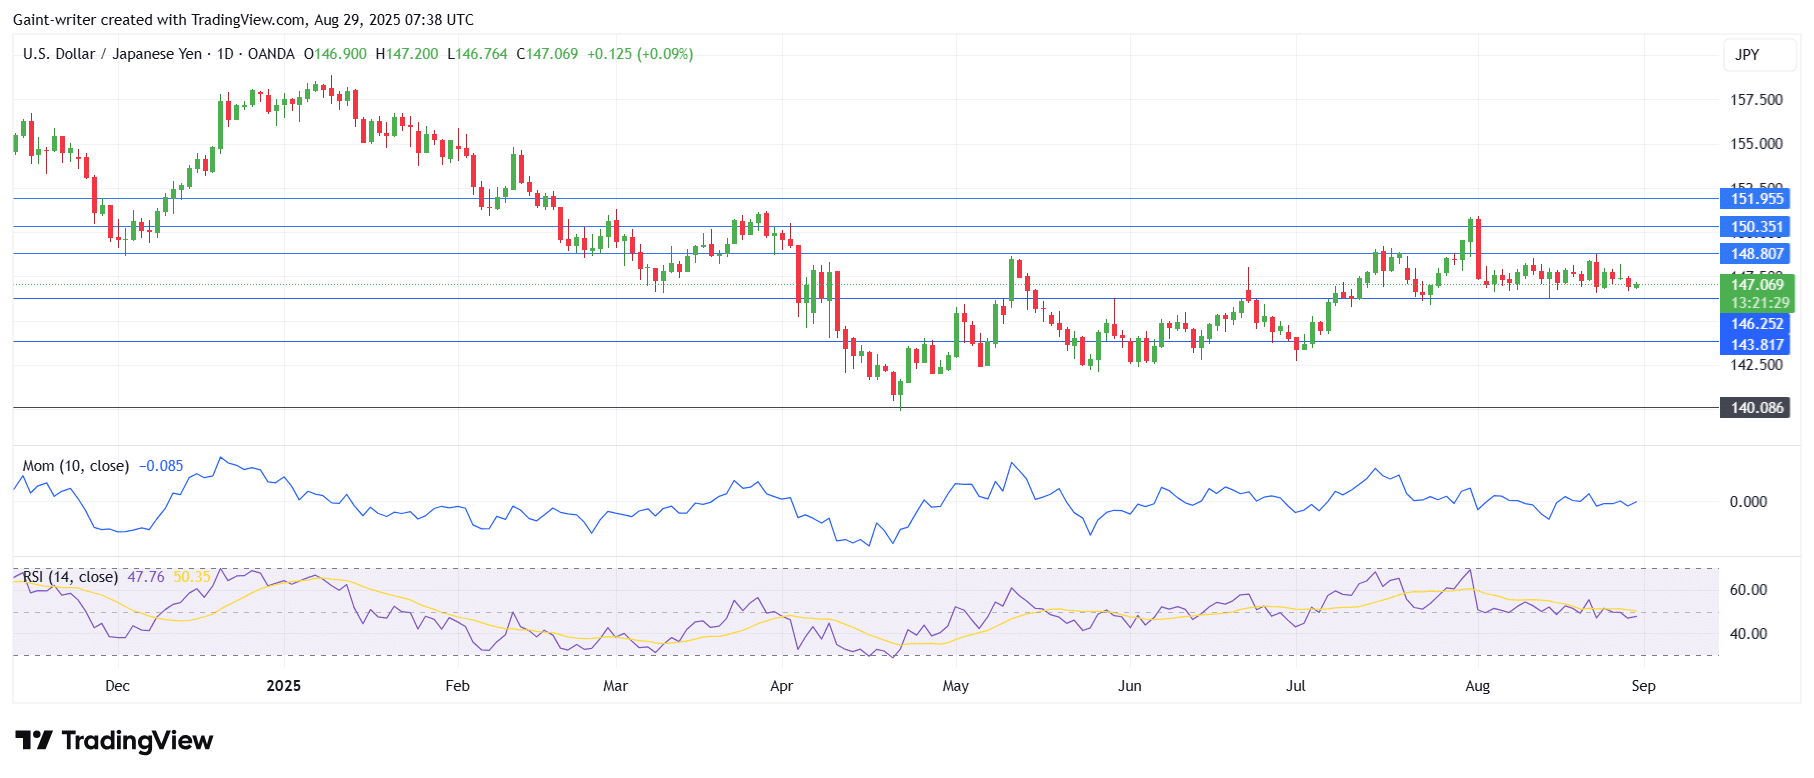
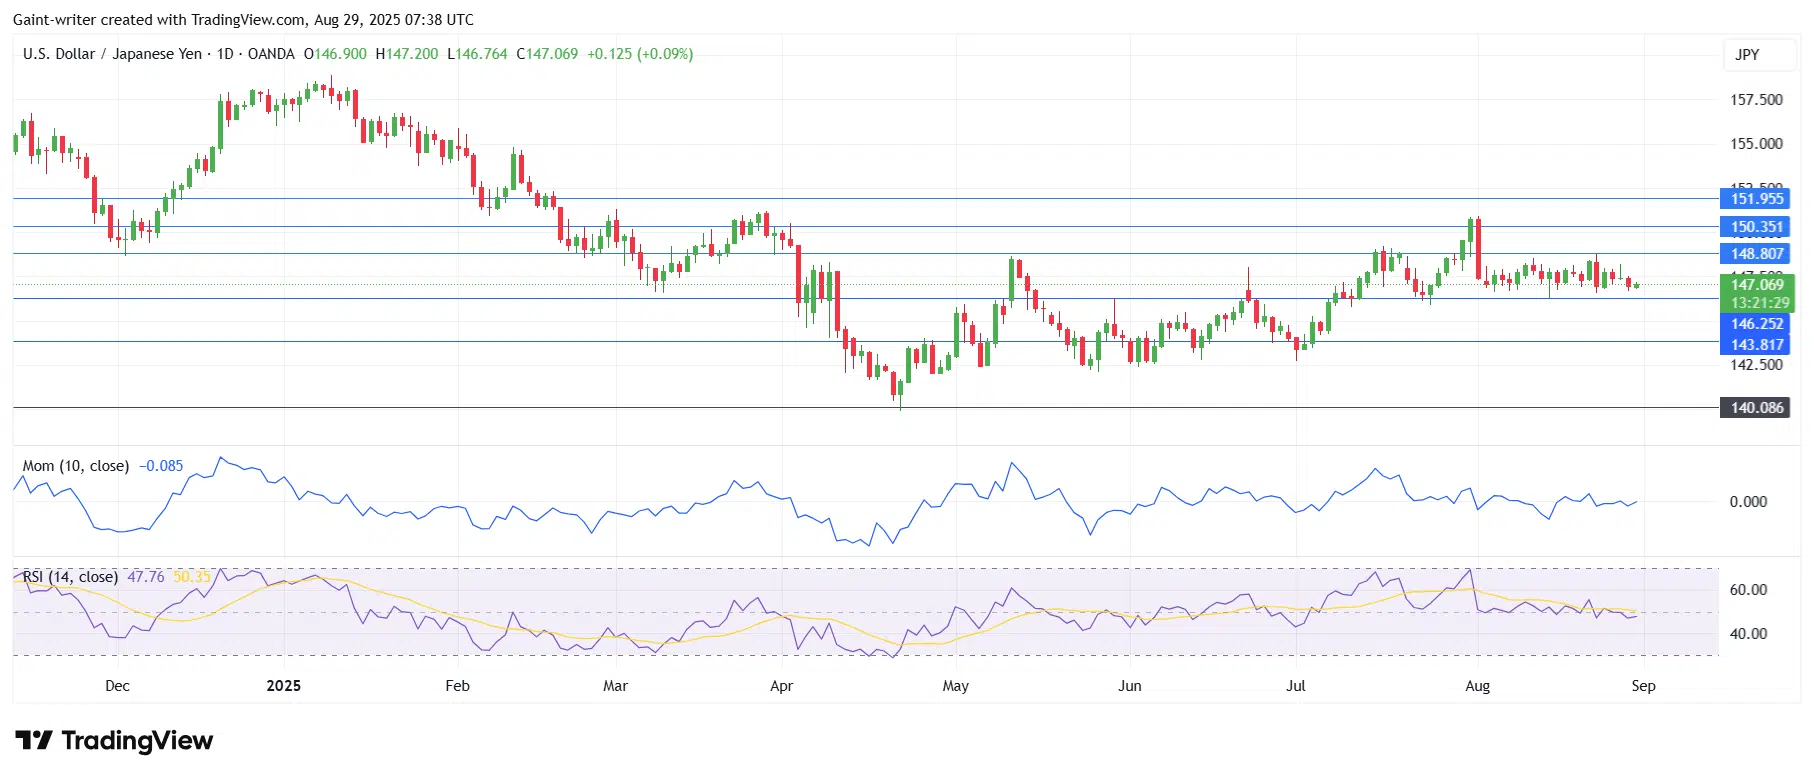
On the daily chart, USDJPY – Guide, Tips & Insights | Learn 2 Trade – Guide, Tips & Insights | Learn 2 Trade trades around 147.060, trapped inside a sideways channel. Earlier in August, bulls attempted a rally but met firm rejection near the 150.351 resistance zone. Since then, momentum has faded, and the pair has slipped into consolidation.
Now, price oscillates mainly between the 145.069 support and the 148.887 resistance. This sideways movement underscores market equilibrium, as neither bulls nor bears possess the strength to dictate a lasting trend.
However, this calm rarely lasts. Sideways ranges often precede bursts of volatility, making a breakout highly probable. A decisive close above 148.887 or below 145.069 would likely define the next directional phase. Technical indicators echo this neutrality: the Momentum indicator hovers just below zero at -0.085, while the RSI (14, close) sits at 47.76, squarely in mid-range territory.
The 4-hour chart magnifies the consolidation. At 147.059, the pair trades in a choppy sideways rhythm, frustrating trend-following traders. Price remains largely confined between 146.759 support and 148.887 resistance, further emphasizing the tight range.
This type of price action signals hesitation. Meanwhile, larger market players may quietly accumulate or distribute positions ahead of a sharp expansion. Once a catalyst emerges, the breakout could deliver strong directional momentum.
Trade on MT4 with Leverage up to 1:500! Trade on MT4 with Leverage up to 1:500!
X
We use cookies to ensure that we give you the best experience on our website. If you continue to use this site we will assume that you are happy with it.
 USDJPY – Guide, Tips & Insights | Learn 2 Trade – Guide, Tips & Insights | Learn 2 Trade Short-Term Trend: Ranging
 USDJPY – Guide, Tips & Insights | Learn 2 Trade – Guide, Tips & Insights | Learn 2 Trade Short-Term Trend: Ranging


