Market Analysis – February 9
The strength of the downward trend on the USDJPY – Guide, Tips & Insights | Learn 2 Trade – Guide, Tips & Insights | Learn 2 Trade market has declined notably since December. The ADX (Average Daily Index) declined gently from December until February.
USDJPY – Guide, Tips & Insights | Learn 2 Trade – Guide, Tips & Insights | Learn 2 Trade Key Zones
Demand Levels: 131.30, 127.50, 124.90
Supply Levels: 134.40, 142.00, 150.00
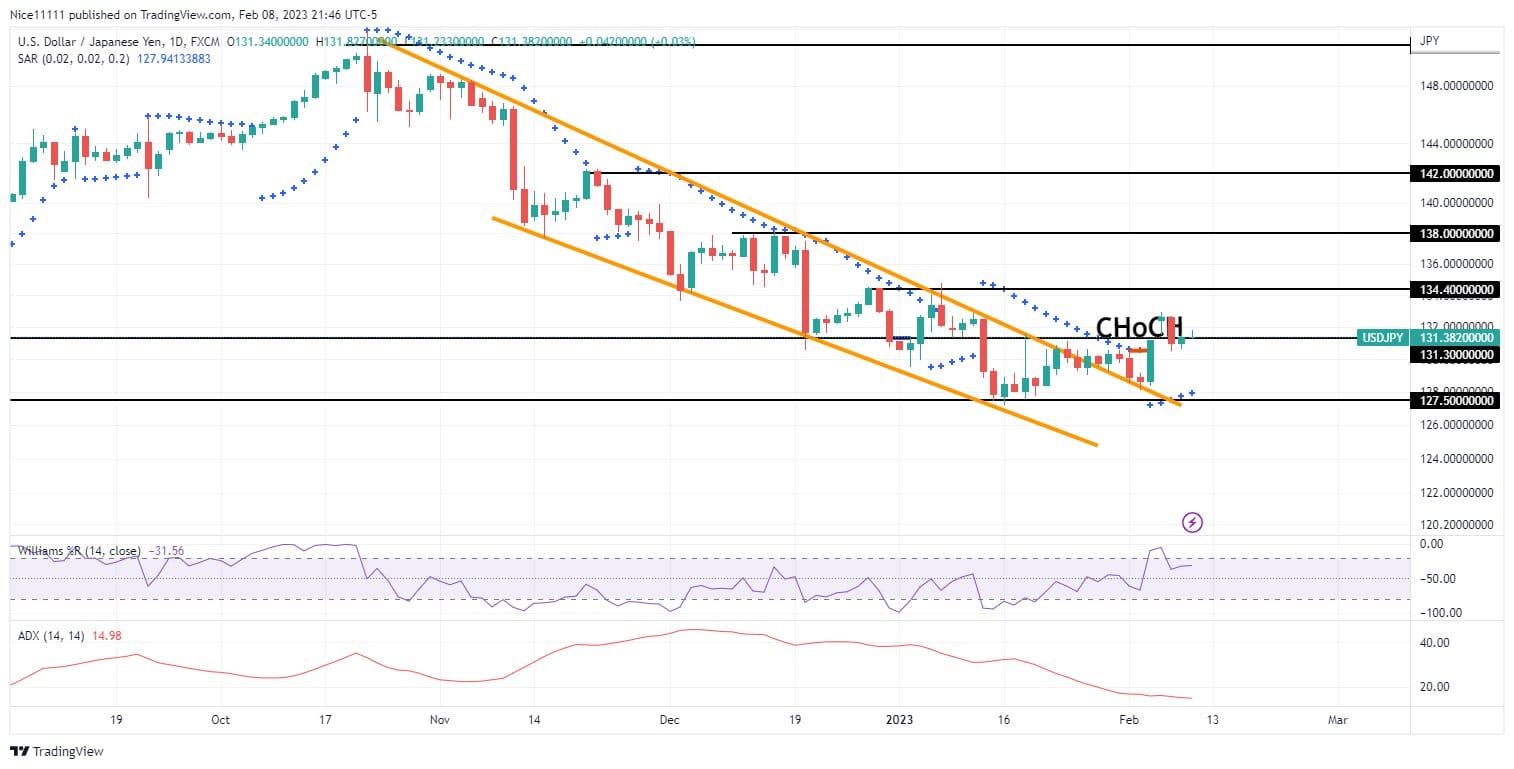
USDJPY – Guide, Tips & Insights | Learn 2 Trade – Guide, Tips & Insights | Learn 2 Trade Long-Term Trend: Bullish
The USDJPY – Guide, Tips & Insights | Learn 2 Trade – Guide, Tips & Insights | Learn 2 Trade’s impulsive swings highlighted the market’s direction. The bullish counter trend movement was sluggish, however the downward delivery was startling. The price declined into the oversold region in January. The buyers utilized the opportunity to benefit from the discounted price. The daily candles broke out of the bearish channel.
The month of February opened with a retest of the descending trendline. The Parabolic SAR (Stop and Reverse) indicator is signifying bullishness on the daily timeframe. The market has ascended to 131.30 after the test of the downward trendline. A retracement to fill up more buying orders is currently anticipated as the Williams % R (Percent Range) is showing that the market is overbought.
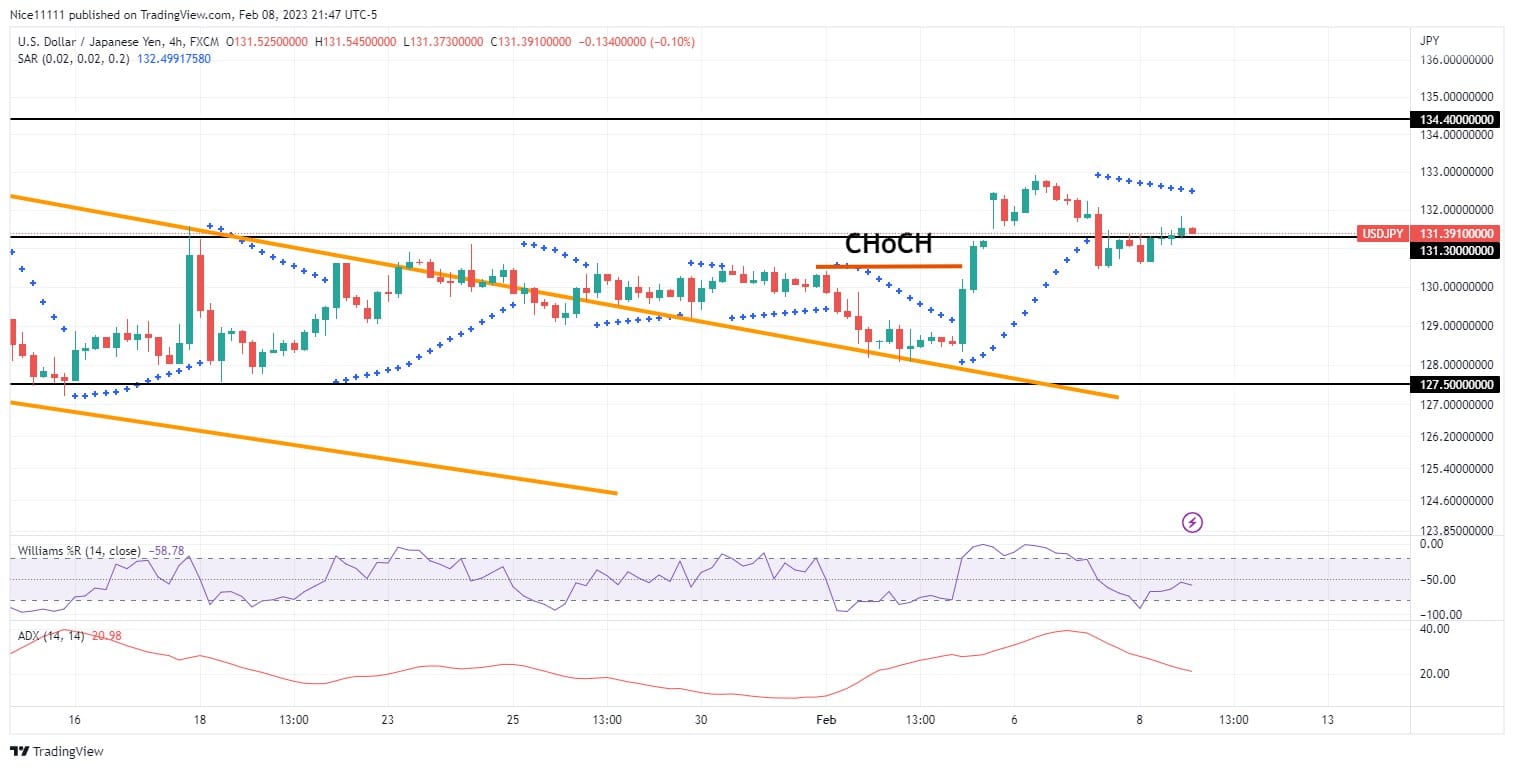
USDJPY – Guide, Tips & Insights | Learn 2 Trade – Guide, Tips & Insights | Learn 2 Trade Short-term Trend: Bullish
In the four-hour timeframe, a change of character (CHoCH) has formed. Long bullish candles spiked away from the bearish trendline, leaving fair value gaps behind. The market is currently retracing back to the demand level of 127.50. The pullback is expected to provide buyers with the opportunity to go long in the market.
Do you want to take your trading to the next level? Join the best platform for that here
- Broker
- Min Deposit
- Score
- Visit Broker

- Award-winning Cryptocurrency trading platform
- $100 minimum deposit,
- FCA & Cysec regulated

- 20% welcome bonus of upto $10,000
- Minimum deposit $100
- Verify your account before the bonus is credited
- Fund Moneta Markets account with a minimum of $250
- Opt in using the form to claim your 50% deposit bonus
Learn to Trade
Never Miss A Trade Again

Signal Notification
Real-time signal notifications whenever a signal is opened, closes or Updated

Get Alerts
Immediate alerts to your email and mobile phone.

Entry Price Levels
Entry price level for every signal Just choose one of our Top Brokers in the list above to get all this free.