Bears’ momentum increase in USDCHF market
USDCHF Price Analysis – 20 September
When buyers’ momentum is successful in holding the $0.88 support level, the price may move past the $0.89 resistance level and toward the $0.90 and $0.91 resistance levels. If sellers apply sufficient pressure, the $0.88 barrier level may be broken, leading to a significant drop in price towards the $0.87 and $0.86 levels.
USDCHF Market
Key Levels:
Resistance levels: $0.89, $0.90, $0.91
Support levels: $0.88, $0.87, $0.86
USDCHF Long-term trend: Bearish
On the daily chart, USDCHF is bearish. At the moment, the USDCHF is decreasing and is not having trouble falling below the $0.89 barrier. The USDCHF market has been dominated by sellers throughout the last week. When the price broke through the support level of $0.90, the currency pair established a downtrend. A bearish trend started when a double top chart pattern emerged. The USDCHF is moving down, approaching $0.88.
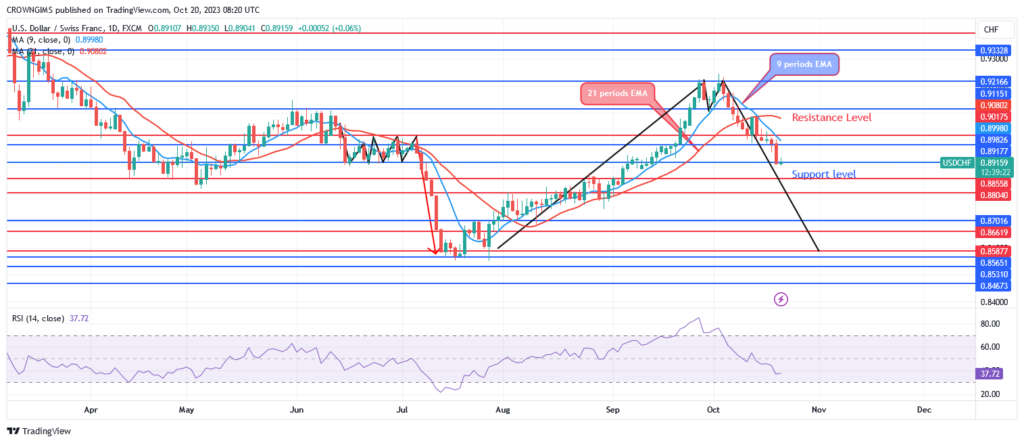
The price of the USD/CHF is currently below the 21- and 9-period moving averages, indicating that the selling momentum may be increasing. The Relative Strength Index period 14 at 51 levels indicates a bearish market. If buyers’ momentum is successful in holding the $0.88 support level, the price may move past the $0.89 resistance level and toward the $0.90 and $0.91 resistance levels. If sellers apply sufficient pressure, the $0.88 barrier level may be broken, leading to a significant drop in price towards the $0.87 and $0.86 levels.
USDCHF Medium-term Trend: Bearish
From a mid-term standpoint, USDCHF is trending downward. The formation of a double-top chart pattern near the $0.92 resistance level signals the start of a bearish trend for the currency pair. Bearish candles are the product of market forces. On October 12, the $0.90 support level was put to the test. It retreated the next day. Currently, sellers’ momentum is increasing and it is targeting a $0.88 support level.
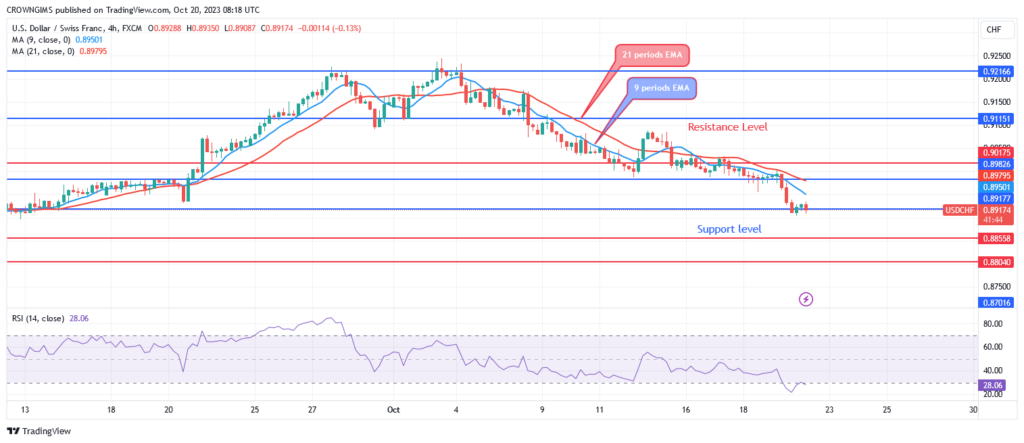
The fact that the currency pair is trading below both the 21- and 9-period exponential moving averages suggests a bearish market. The Relative Strength Index period 14 signal line is going downward, suggesting a sell, and the index is currently at 36.
You can purchase Lucky Block – Guide, Tips & Insights | Learn 2 Trade here. Buy LBLOCK
- Broker
- Min Deposit
- Score
- Visit Broker

- Award-winning Cryptocurrency trading platform
- $100 minimum deposit,
- FCA & Cysec regulated

- 20% welcome bonus of upto $10,000
- Minimum deposit $100
- Verify your account before the bonus is credited
- Fund Moneta Markets account with a minimum of $250
- Opt in using the form to claim your 50% deposit bonus
Learn to Trade
Never Miss A Trade Again

Signal Notification
Real-time signal notifications whenever a signal is opened, closes or Updated

Get Alerts
Immediate alerts to your email and mobile phone.

Entry Price Levels
Entry price level for every signal Just choose one of our Top Brokers in the list above to get all this free.