Sellers may continue to dominate USDCHF market
USDCHF Price Analysis – 13 September
USDCHF may rise past the $0.91 resistance level and toward the $0.92 and $0.93 resistance levels if buyers’ momentum is effective in holding the $0.90 support level. The $0.90 barrier level can be breached if sellers exert enough pressure, which would result in a substantial price decline into the $0.89 and $0.88 levels.
USDCHF Market
Key Levels:
Resistance levels: $0.91, $0.92, $0.93
Support levels: $0.90, $0.89, $0.88
USDCHF Long-term trend: Bearish
USDCHF is bearish on the daily chart. The USDCHF is currently retracting and finding it difficult to rise over the $0.92 limit. For the preceding month, buyers dominated the USDCHF market. The currency pair formed a small double-top chart pattern when the resistance level of $0.92 was unable to be broken by the price. Following the appearance of a double top chart pattern, a bearish trend began. The USDCHF is declining towards the $0.90 level.
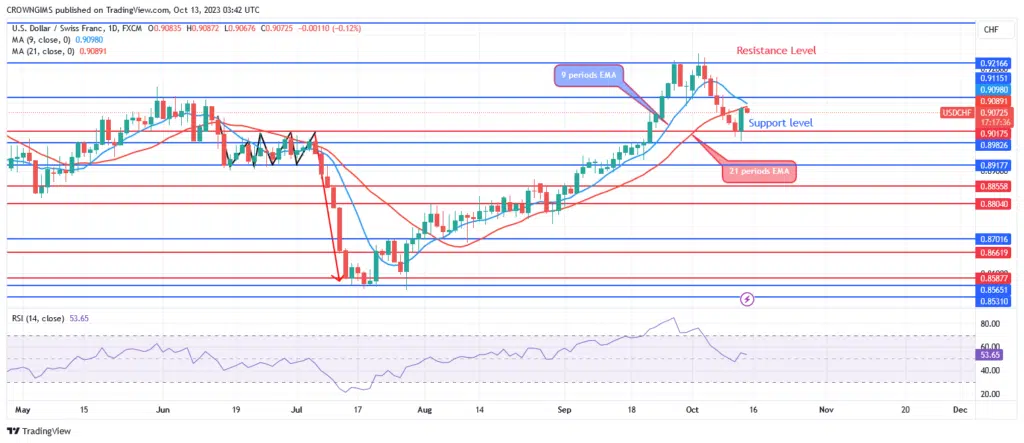
The current location of the USD/CHF price below the 9- and 21-period EMAs suggests that the momentum of the selling may pick up. A bearish market is indicated by the Relative Strength Index period 14 at 51 levels. The price may rise past the $0.91 resistance level and toward the $0.92 and $0.93 resistance levels if buyers’ momentum is effective in holding the $0.90 support level. The $0.90 barrier level can be breached if sellers exert enough pressure, which would result in a substantial price decline into the $0.89 and $0.88 levels.
USDCHF Medium-term Trend: Bearish
In the mid-term perspective, USDCHF is moving in a bearish direction. As a result of the double top chart pattern forming near the $0.92 resistance level, the currency pair commences a bearish journey. Market forces result in bearish candles. The $0.90 support level was tested on 12 October. The following day, it pulled back. Sellers are returning in to the market at the moment, bearish trend may continue.
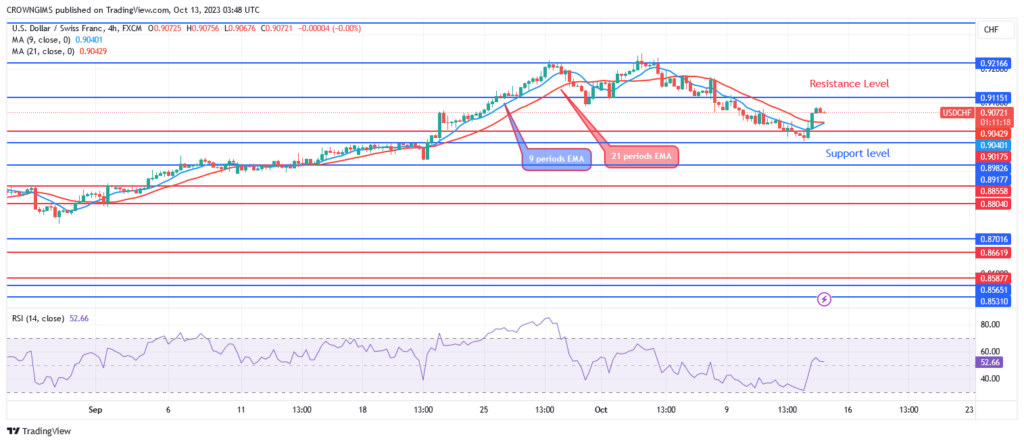
The currency pair is trading higher than both the 9-period and 21-period exponential moving averages, which indicates a bullish market or pullback. The signal line on the Relative Strength Index period 14 is pointing down, indicating a sell, and the index is at 51.
You can purchase Lucky Block – Guide, Tips & Insights | Learn 2 Trade here. Buy LBLOCK
- Broker
- Min Deposit
- Score
- Visit Broker

- Award-winning Cryptocurrency trading platform
- $100 minimum deposit,
- FCA & Cysec regulated

- 20% welcome bonus of upto $10,000
- Minimum deposit $100
- Verify your account before the bonus is credited
- Fund Moneta Markets account with a minimum of $250
- Opt in using the form to claim your 50% deposit bonus
Learn to Trade
Never Miss A Trade Again

Signal Notification
Real-time signal notifications whenever a signal is opened, closes or Updated

Get Alerts
Immediate alerts to your email and mobile phone.

Entry Price Levels
Entry price level for every signal Just choose one of our Top Brokers in the list above to get all this free.