Sellers’ momentum may increase in USDCHF market
USDCHF Price Analysis – 06 September
In case buyers’ momentum is successful in holding the $0.91 support level, the price may increase past the $0.92 resistance level and toward the $0.93 and $0.94 resistance levels. If sellers apply enough pressure, the $0.91 barrier level can be broken, which would cause a significant drop in price into the $0.90 and $0.89 levels.
USDCHF Market
Key Levels:
Resistance levels: $0.92, $0.93, $0.94
Support levels: $0.91, $0.90, $0.89
USDCHF Long-term trend: Bullish
On the daily chart, USDCHF is bullish. As it is now retreating, USDCHF is struggling to surpass the $0.92 ceiling. The USDCHF market was dominated by buyers for the previous month. The price breached the last resistance level of $0.89. Increased buyers’ pressure was applied to the price on 21 September and it twice tested the $0.92 mark. A bearish trend started after a double top chart pattern appeared. The $0.92 ceiling is proving to be a barrier for the USDCHF.
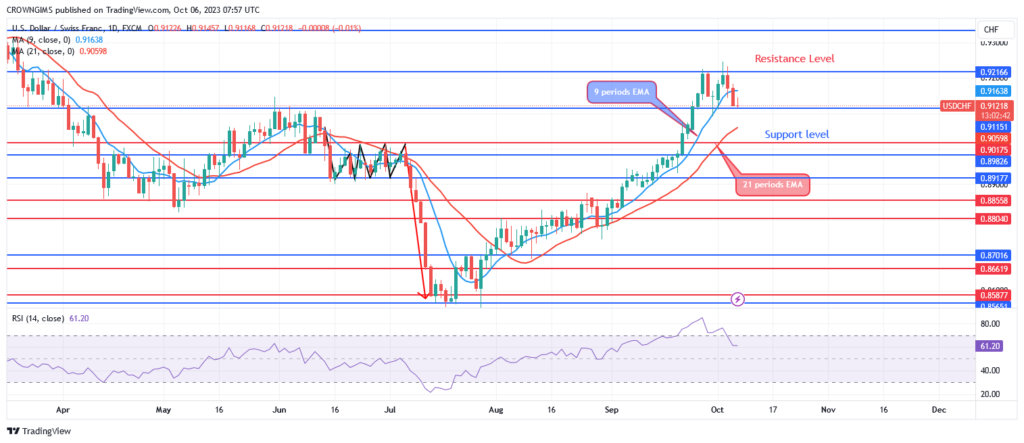
The USD/CHF price current position between the 9- and 21-period EMAs indicates that sellers’ momentum may increase. The Relative Strength Index period 14 at 61 levels indicates a bearish market. If buyers’ momentum is successful in holding the $0.91 support level, the price may increase past the $0.92 resistance level and toward the $0.93 and $0.94 resistance levels. If sellers apply enough pressure, the $0.91 barrier level can be broken, which would cause a significant drop in price into the $0.90 and $0.89 levels.
USDCHF Medium-term Trend: Bearish
USDCHF is on a bearish movement in the medium-term outlook. It seems the currency pair is about to start a bearish movement with the formation of a double-top chart pattern at the $0.92 resistance level. Bearish candles are produced by the market. The bears are exerting pressure on the support level of $0.91 at the moment. The downward break at the $0.91 support level may establish a downtrend.
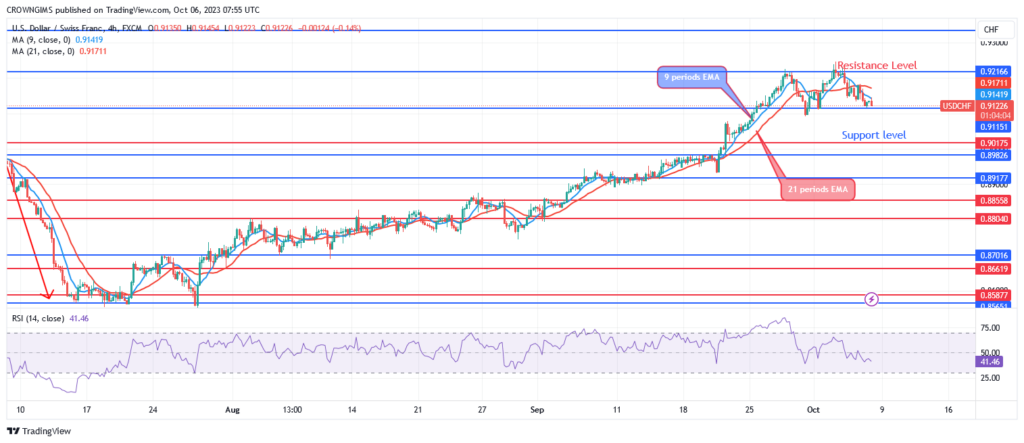
The currency pair is trading below both the 9-period EMA and the 21-period EMA, indicating a bearish market. The Relative Strength Index period 14 is at 42, with its signal line pointing downward to indicate a sell.
You can purchase Lucky Block – Guide, Tips & Insights | Learn 2 Trade here. Buy LBLOCK
- Broker
- Min Deposit
- Score
- Visit Broker

- Award-winning Cryptocurrency trading platform
- $100 minimum deposit,
- FCA & Cysec regulated

- 20% welcome bonus of upto $10,000
- Minimum deposit $100
- Verify your account before the bonus is credited
- Fund Moneta Markets account with a minimum of $250
- Opt in using the form to claim your 50% deposit bonus
Learn to Trade
Never Miss A Trade Again

Signal Notification
Real-time signal notifications whenever a signal is opened, closes or Updated

Get Alerts
Immediate alerts to your email and mobile phone.

Entry Price Levels
Entry price level for every signal Just choose one of our Top Brokers in the list above to get all this free.