Buyers’ pressure decrease in USDCHF market
USDCHF Price Analysis – 29 September
USDCHF may rise past the $0.92 resistance level and toward the $0.93 and $0.94 resistance levels if buyers’ momentum is effective in holding the $0.91 support level. The $0.91 barrier level can be broken if sellers exert enough pressure, which would result in a substantial price decline into the $0.90 and $0.89 levels.
USDCHF Market
Key Levels:
Resistance levels: $0.92, $0.93, $0.94
Support levels: $0.91, $0.90, $0.89
USDCHF Long-term trend: Bullish
The USDCHF is increasing on the daily chart. Now that it is inclining, the USDCHF is rising above the $0.90 ceiling. Since July, buyers have dominated the USDCHF market. The previous resistance level of $0.89 was broken by the price. Gradually, the price increased and reached a plateau of about $0.90. On September 25, more buyers pushed the price past the $0.91 and tested $0.92 barrier level. The USDCHF is currently pulling back.
 .92 Resistance Level, Bearish Reversal Envisaged" width="580" height="251" data-lazy-src="https://learn2.trade/wp-content/uploads/2023/09/Daily-67-1024x443.png"/>
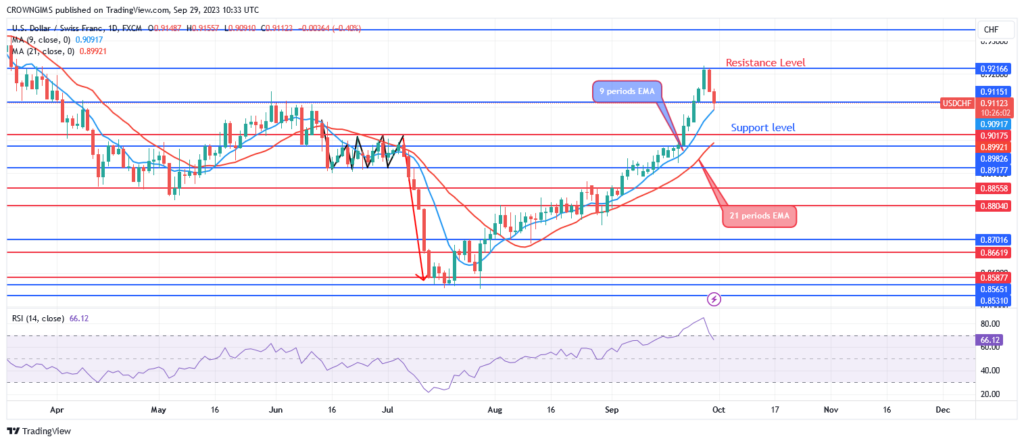
The fact that the USD/CHF is currently trading at close range to the 9- and 21-period EMAs indicates that the momentum of buyers is getting weak. A bearish market is indicated by the Relative Strength Index period 14 at 66 levels. USDCHF may rise past the $0.92 resistance level and toward the $0.93 and $0.94 resistance levels if buyers’ momentum is effective in holding the $0.91 support level. The $0.91 barrier level can be broken if sellers exert enough pressure, which would result in a substantial price decline into the $0.90 and $0.89 levels.
USDCHF Medium-term Trend: Bearish
In the medium term, USDCHF is negative. The double bottom chart pattern developed at the $0.85 support level made a bullish trend to $0.91 resistance level. The market generates bearish candles at a level just mentioned. The previous dynamic support levels have turned to resistance levels. At the $0.91 support level, the downward break took place. As the price approaches $0.90, it is falling.
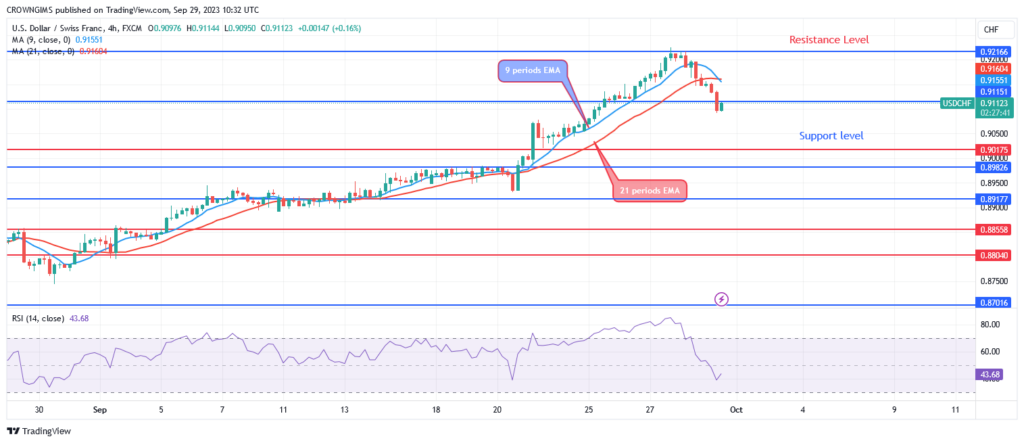
Indicating a bearish market, the currency pair is trading below both the 9-period EMA and the 21-period EMA. The indicator is currently at 46, and the Relative Strength indicator period 14 signal line is pointing downward and indicating a sell.
You can purchase Lucky Block – Guide, Tips & Insights | Learn 2 Trade here. Buy LBLOCK
- Broker
- Min Deposit
- Score
- Visit Broker

- Award-winning Cryptocurrency trading platform
- $100 minimum deposit,
- FCA & Cysec regulated

- 20% welcome bonus of upto $10,000
- Minimum deposit $100
- Verify your account before the bonus is credited
- Fund Moneta Markets account with a minimum of $250
- Opt in using the form to claim your 50% deposit bonus
Learn to Trade
Never Miss A Trade Again

Signal Notification
Real-time signal notifications whenever a signal is opened, closes or Updated

Get Alerts
Immediate alerts to your email and mobile phone.

Entry Price Levels
Entry price level for every signal Just choose one of our Top Brokers in the list above to get all this free.