Sellers’ momentum increase in USDCHF market
USDCHF Price Analysis – 03 November
USDCHF may go past the $0.90 resistance level and toward the $0.91 barrier levels if the buying momentum is effective in breaking up the $0.89 resistance level. The $0.88 barrier level might be broken by sellers exerting enough pressure, which would cause the price to drop sharply in the direction of the $0.87 and $0.86 levels.
USDCHF Market
Key Levels:
Resistance levels: $0.89, $0.90, $0.91
Support levels: $0.88, $0.87, $0.86
USDCHF Long-term trend: Bearish
On the daily chart, USDCHF is bearish. At the moment, sellers are in charge of USDCHF, and it is falling. It is not experiencing any problems breaking down the $0.89 threshold. Since October 24, buyers have controlled the USDCHF market. The price of the currency pair began to rise when it cleared the $0.88 resistance level. At the $0.90 resistance level, a strong bearish engulfing candle pattern appeared, signaling the beginning of a bearish trend. The USDCHF is decreasing and is approaching the $0.88 mark.
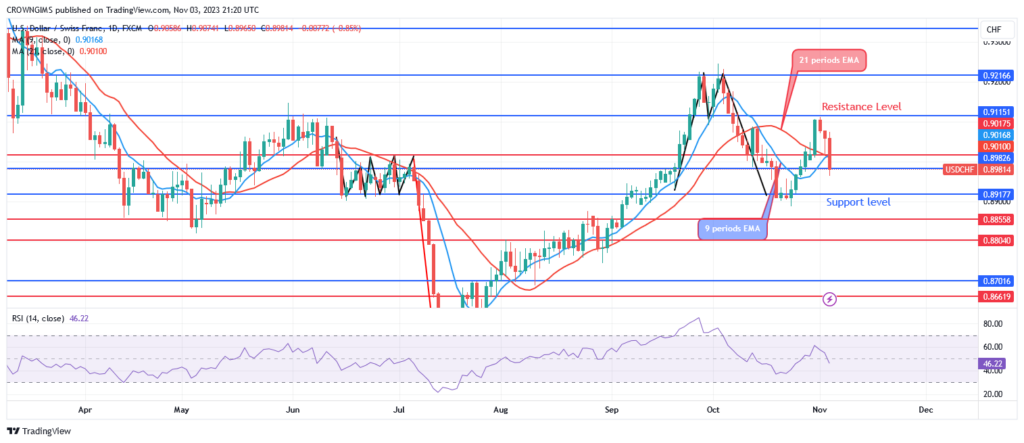
The fact that the price of the USD/CHF is below the 9- and 21-period moving averages right now suggests that vendors’ momentum is strengthening. A bearish market is indicated by the Relative Strength Index period 14 at 46 levels. USDCHF may go past the $0.90 resistance level and toward the $0.91 barrier level if the buying momentum is effective in breaking up the $0.89 resistance level. The $0.88 barrier level might be broken by sellers exerting enough pressure, which would cause the price to drop sharply in the direction of the $0.87 and $0.86 levels.
USDCHF Medium-term Trend: Bearish
USDCHF is trending downward in a mid-term standpoint. The beginning of a bearish trend for the currency pair is indicated by the appearance of a double top chart pattern close to the $0.92 resistance level on October 4. Bearish candles are the result of market dynamics. The $0.89 support level was tested on October 24. It retraced to the $.90 level. The sellers’ momentum is currently building and it is aiming for a support level of $0.88.
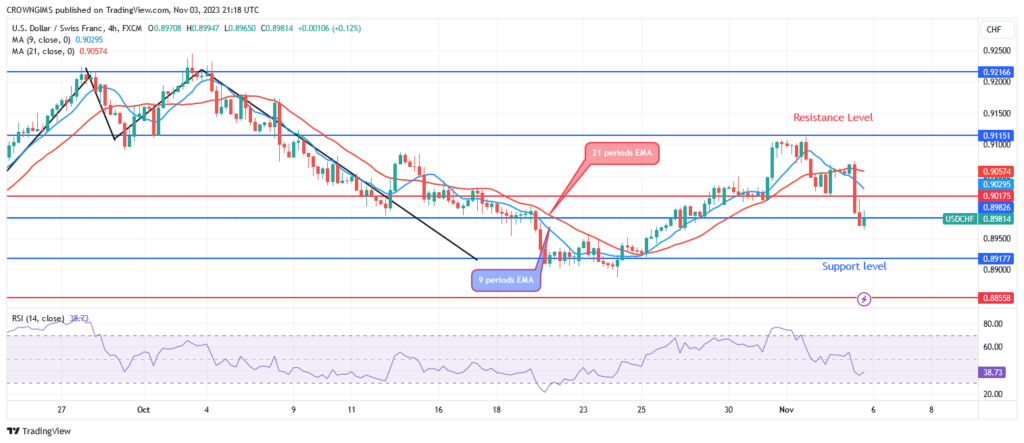
A bearish market is indicated by the fact that the currency pair is trading below both the 9- and 21-period exponential moving averages. The period 14 signal line of the Relative Strength Index is falling, indicating a sell; the index is currently at 38.
You can purchase Lucky Block – Guide, Tips & Insights | Learn 2 Trade here. Buy LBLOCK
- Broker
- Min Deposit
- Score
- Visit Broker

- Award-winning Cryptocurrency trading platform
- $100 minimum deposit,
- FCA & Cysec regulated

- 20% welcome bonus of upto $10,000
- Minimum deposit $100
- Verify your account before the bonus is credited
- Fund Moneta Markets account with a minimum of $250
- Opt in using the form to claim your 50% deposit bonus
Learn to Trade
Never Miss A Trade Again

Signal Notification
Real-time signal notifications whenever a signal is opened, closes or Updated

Get Alerts
Immediate alerts to your email and mobile phone.

Entry Price Levels
Entry price level for every signal Just choose one of our Top Brokers in the list above to get all this free.