Buyers may dominate USDCHF market soon
USDCHF Price Analysis – 23 August
If the buying momentum can sustain over the $0.85 resistance level, USDCHF can move above $0.86 and approach the $0.87 barrier levels. If sellers exert enough pressure, they can drive the price past $0.84 and into the $0.83 and $0.82 areas.
Key Levels:
Resistance levels: $0.85, $0.86, $0.87
Support levels: $0.84m $0.83, $0.82
USDCHF Long-term trend: Bearish
The USDCHF daily chart is trending downward. Customers benefited from a bearish USDCHF market, but not by nearly as much as $0.87. The USDCHF market was under buyer control from May 1 to June 20. The price of the currency pair was almost precisely $0.921 a few weeks ago. Near the first suggested level, there was a bearish engulfing candle pattern. Instantly, the price dropped to $0.85, signifying a significant loss. Two tests of the previously determined support level signaled the beginning of the bearish trend. It is currently retreating near the $0.84 mark.
 .84 Level and Rebound" width="580" height="259" data-lazy-src="https://learn2.trade/wp-content/uploads/2024/08/Daily-56-1024x458.png"/>
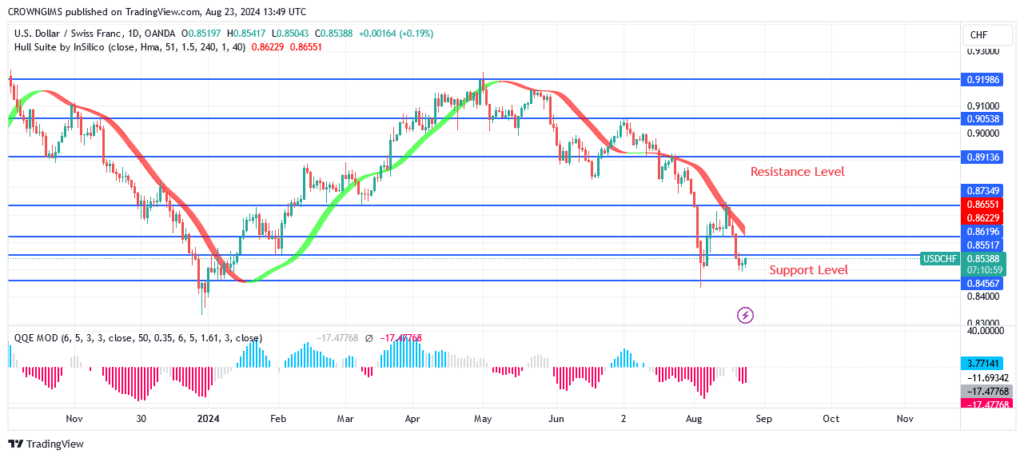
USDCHF Medium-term Trend: Bearish
It is clear that the USDCHF is decreasing in the medium run. A few days ago, near the $0.84 support level, the bullish engulfing candle pattern appeared, indicating the beginning of the currency pair’s incline. The price made another effort to breach the $0.87 resistance level on August 15, but it was unable to keep on course. The price is currently coming close to $0.84.
.84 Level and Rebound" width="580" height="259" data-lazy-src="https://learn2.trade/wp-content/uploads/2024/08/4-hours-68-1024x458.png"/>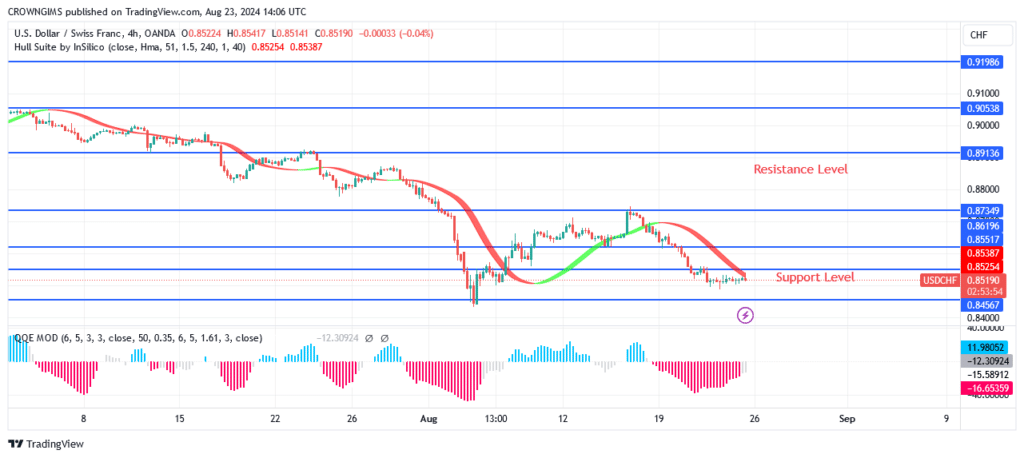
Start using a world-class auto trading solution
You can purchase Lucky Block – Guide, Tips & Insights | Learn 2 Trade here. Buy LBLOCK
- Broker
- Min Deposit
- Score
- Visit Broker

- Award-winning Cryptocurrency trading platform
- $100 minimum deposit,
- FCA & Cysec regulated

- 20% welcome bonus of upto $10,000
- Minimum deposit $100
- Verify your account before the bonus is credited
- Fund Moneta Markets account with a minimum of $250
- Opt in using the form to claim your 50% deposit bonus
Learn to Trade
Never Miss A Trade Again

Signal Notification
Real-time signal notifications whenever a signal is opened, closes or Updated

Get Alerts
Immediate alerts to your email and mobile phone.

Entry Price Levels
Entry price level for every signal Just choose one of our Top Brokers in the list above to get all this free.