USDCHF Price Analysis – May 20
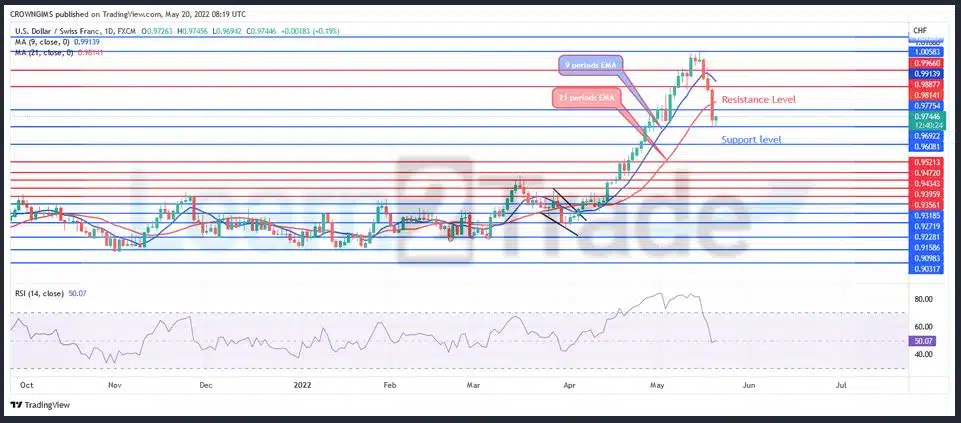
When the support level of $0.96 holds, bullish momentum may increase, USDCHF price may bounce off the level, then, 0.97 levels may be reached and it may incline to $0.98 and $0.99 level. Should the bears break down the support level of $0.96, the price may decrease towards $0.95, and $0.94 levels.
USDCHF Market
Key Levels:
Resistance levels: $0.97, $0.98, $0.99
Support levels: $0.96, $0.95, $0.94
USDCHF Long-term trend: Bearish
USDCHF is bearish on the long-term outlook. The resistance level of $1.0 was tested on May 16 by the pressure of bulls. The just mentioned level holds and price could not break it up. An inverted pin bar formed and the price obey the command. Strong bearish daily candles formed and the price decreases to $0.96 support level. The former support levels of $0.98 and $0.97 have turned to resistance levels.
USDCHF Medium-term Trend: Bearish
USDCHF is bearish in the medium-term outlook. Buyers lose momentum at the resistance level of $1.00. The price reverses and break down former support levels of $0.98 and $0.97. Sellers are currently dominating the USDCHF market. Pullback may be expected in any trending market. Further price reduction is expected.
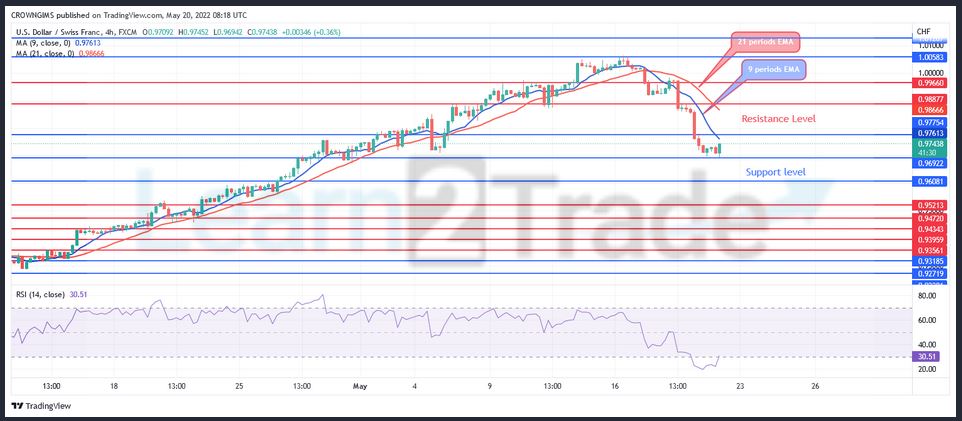
The 9 period EMA has crossed the 21 periods EMA downside. USDCHF is trading below the two EMAs as the price is decreasing. The Relative Strength Index period 14 is at 29 levels with signal line showing bullish direction which may be a pullback .
- Broker
- Min Deposit
- Score
- Visit Broker

- Award-winning Cryptocurrency trading platform
- $100 minimum deposit,
- FCA & Cysec regulated

- 20% welcome bonus of upto $10,000
- Minimum deposit $100
- Verify your account before the bonus is credited
- Fund Moneta Markets account with a minimum of $250
- Opt in using the form to claim your 50% deposit bonus
Learn to Trade
Never Miss A Trade Again

Signal Notification
Real-time signal notifications whenever a signal is opened, closes or Updated

Get Alerts
Immediate alerts to your email and mobile phone.

Entry Price Levels
Entry price level for every signal Just choose one of our Top Brokers in the list above to get all this free.