Market Analysis – April 20
The USDCAD market experienced a bullish breakout in February. A retracement followed to establish a retest upon the breakout. After a bounce off the previous resistance trendline, the price fell below the confluence zone.
USDCAD Key Levels
Demand Levels: 1.3180, 1.2980, 1.2820
Supply Levels: 1.3520, 1.3690, 1.3880
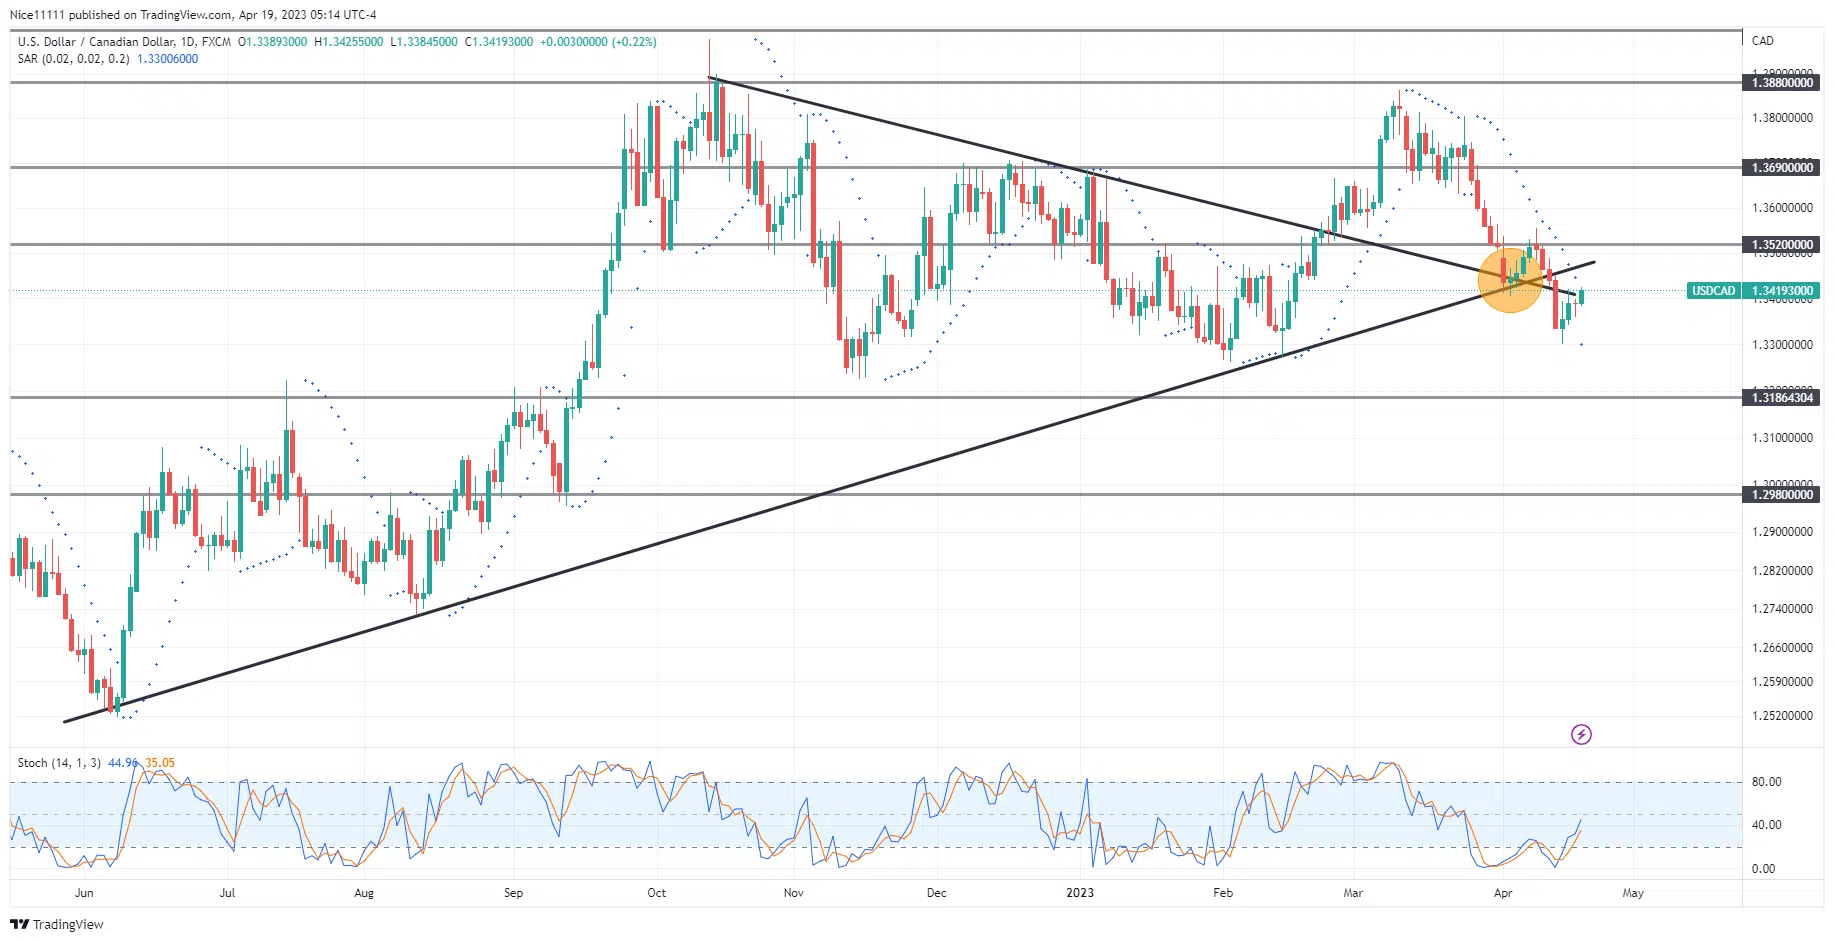
USDCAD Long-term Trend: Bearish
USDCAD confluence level originated from the cross of the ascending and descending trendlines on the daily chart. The ascending trendline was anchored on the higher lows formed in January and August last year and also in February 2023. The swing lows were observed to have formed when the Stochastic was oversold. The Parabolic SAR had also signaled the halt of the pullback immediately after the formation of the swing lows.
The descending trendline was also anchored on the head and shoulders pattern, which formed the high in October, and the triple top pattern, which formed the lower high in December. Both the head and shoulders pattern and the triple top bearish patterns were formed when the Stochastic indicated the market was overbought.

USDCAD Short-term Trend: Bearish
The test of the confluence zone formed by the cross of the ascending and descending trendlines after the bullish breakout provided insufficient fuel for the price to fly. The price has dived below the confluence region. The retest on the ascending trendline may serve as resistance to shooting the price to the lower key level of 1.3180.
Do you want to take your trading to the next level? Join the best platform for that here
- Broker
- Min Deposit
- Score
- Visit Broker

- Award-winning Cryptocurrency trading platform
- $100 minimum deposit,
- FCA & Cysec regulated
9.8

- 20% welcome bonus of upto $10,000
- Minimum deposit $100
- Verify your account before the bonus is credited
9
- Fund Moneta Markets account with a minimum of $250
- Opt in using the form to claim your 50% deposit bonus
9
Learn to Trade
Never Miss A Trade Again

step 1
Signal Notification
Real-time signal notifications whenever a signal is opened, closes or Updated

step 2
Get Alerts
Immediate alerts to your email and mobile phone.

step 3
Entry Price Levels
Entry price level for every signal Just choose one of our Top Brokers in the list above to get all this free.