

Key Resistance Levels: 111.000, 112.000, 113.000
Key Support Levels: 104.000, 103.000, 102.000
USD/JPY Price Long-term Trend: Bullish
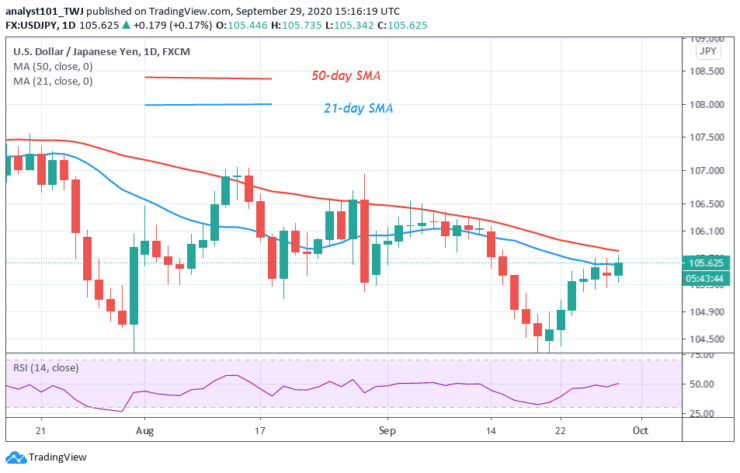
The USD/JPY pair was on a downward move. The price fell to the low of 102.27 and resume upward move. The Yen is currently facing resistance at the 21-day SMA. It is likely to rise if price breaks above the EMAs. The uptrend is likely to be delayed.
Daily Chart Indicators Reading:
The 50-day SMA and 21-day SMA are sloping horizontally indicating a sideways trend. The Yen is currently at level 50 of the daily Relative Strength Index. This indicates that there is a balance between supply and demand.
USD/JPY Medium-term Trend: Bullish
On the 4-hour chart, the Yen has resumed uptrend but faces initial resistance at level 105. A red candle body tested 78.6 Fibonacci retracement level. The Yen will rise and reach a high of 1.272 extension level. That is the high level 106.16. However, the Yen will later reverse.

4-hour Chart Indicators Reading
The Yen is currently above the 75% range of daily stochastic. It is approaching the oversold region of the market. Also, it is in a bullish momentum. The SMAs are sloping upward indicating the uptrend.
General Outlook for USD/JPY
The USD/JPY pair was in an upward move. The Yen is in a strong bullish momentum. According to the Fibonacci tool, the Yen will fall and reach a level at 1.272 Fibonacci extension level. That is, the pair will reach level 106.16
Note: Learn2Trade.com is not a financial advisor. Do your research before investing your funds in any financial asset or presented product or event. We are not responsible for your investing results


