Key Support Levels: 1.34000, 1.32000, 1.30000
USD/CAD Price Long-term Trend: Ranging
The Loonie has been in a sideways trend after a downward move. During the bearish market, the bull candle body tested the 0.382 retracement level. This bull candle body determines the extent of price fall. The Fibonacci tool indicates that the pair will reverse at the 1.618 extension level. The Canadian dollar has reversed but now in a sideways trend. The price is fluctuating between level 1.38553 and 1.42000.
Daily Chart Indicators Reading:
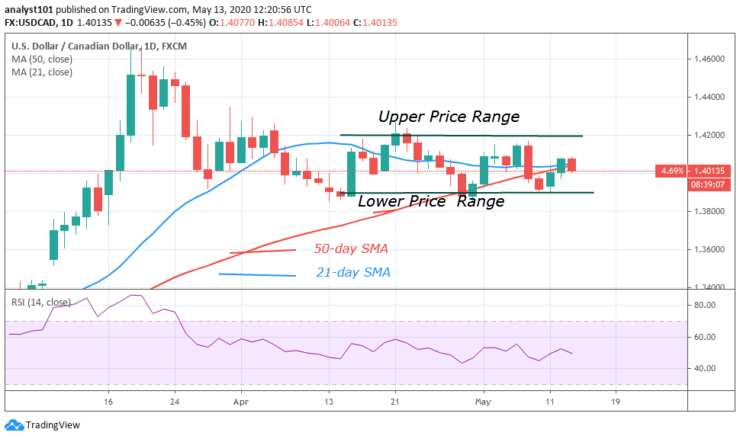
The 50-day SMA and the 21-day SMA are sloping horizontally indicating the sideways trend. Also, the Loonie is at level 54 of the Relative Strength Index. This indicates that the pair is in the uptrend and also above the centerline 50.
USD/CAD Medium-term Trend: Ranging
On the 4-hour chart, the pair is in a horizontal channel. The market is fluctuating between the upper and lower price range. Today, price is falling after reaching level 1.41000. The price is likely to rebound after testing the lower price range.
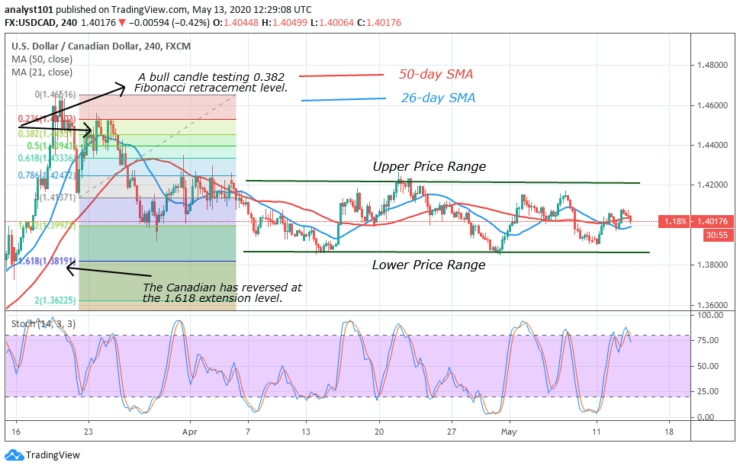
4-hour Chart Indicators Reading
Presently, the 21-day SMA and 50-day SMA are slowing horizontally indicating the earlier sideways move. The Canadian dollar is below 80% range of the daily stochastic. It implies that the market is in bearish momentum.
General Outlook for USD/CAD
The USD/CAD pair is currently is in a sideways move. The Loonie is ranging both in the short and long trend. The SMAs are horizontally flat depicting the sideways move.
Note: Learn2.Trade is not a financial advisor. Do your research before investing your funds in any financial asset or presented product or event. We are not responsible for your investing results
- Broker
- Min Deposit
- Score
- Visit Broker

- Award-winning Cryptocurrency trading platform
- $100 minimum deposit,
- FCA & Cysec regulated

- 20% welcome bonus of upto $10,000
- Minimum deposit $100
- Verify your account before the bonus is credited
- Fund Moneta Markets account with a minimum of $250
- Opt in using the form to claim your 50% deposit bonus
Learn to Trade
Never Miss A Trade Again

Signal Notification
Real-time signal notifications whenever a signal is opened, closes or Updated

Get Alerts
Immediate alerts to your email and mobile phone.

Entry Price Levels
Entry price level for every signal Just choose one of our Top Brokers in the list above to get all this free.