Key Resistance Levels: 1.42000, 1.44000, 1.46000
Key Support Levels: 1.34000, 1.32000, 1.30000
USD/CAD Price Long-term Trend: Ranging
The Loonie is in a downtrend. In June the pair fell to level 1.3300 low and resumed a sideways move. It is fluctuating between levels 1.3400 and 1.3700. These range-bound levels have not been broken since June 8. Today, the price action is showing a bearish signal.
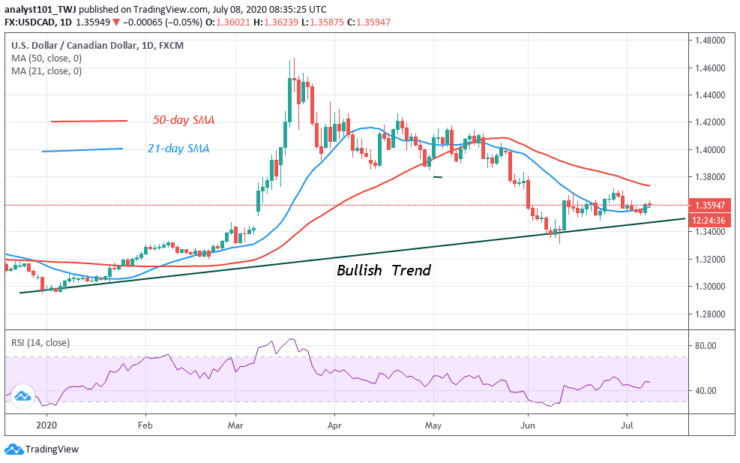
Daily Chart Indicators Reading:
The 50-day SMA and the 21-day SMA are sloping downward indicating the sideways trend. The Loonie has fallen to level 48 of the Relative Strength Index. This indicates that the pair is in the downtrend and below the centerline 50.
USD/CAD Medium-term Trend: Ranging
On the 4-hour chart, the pair is in a range of pound movement. The pair is fluctuating between levels 1.3500 and 1.3700. The pair is in a downward move after retesting level 1.3600. The selling pressure may reach a low of 1.3520. The price is falling because it has reached the overbought region.
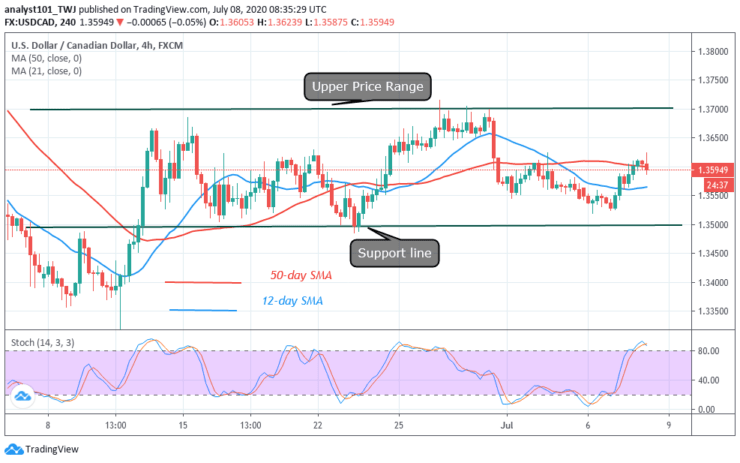
4-hour Chart Indicators Reading
Presently, the SMAs are slowing horizontally indicating the earlier sideways move. The Loonie is above 80% range of the daily stochastic. It implies that the market is in the overbought region. Sellers have emerged to push prices down.
General Outlook for USD/CAD
The USD/CAD pair is falling in a sideways trend. It is unclear the extent of the downtrend. The market may fall to the previous low at level 1.3520.
Note: Learn2.Trade is not a financial advisor. Do your research before investing your funds in any financial asset or presented product or event. We are not responsible for your investing results
- Broker
- Min Deposit
- Score
- Visit Broker

- Award-winning Cryptocurrency trading platform
- $100 minimum deposit,
- FCA & Cysec regulated

- 20% welcome bonus of upto $10,000
- Minimum deposit $100
- Verify your account before the bonus is credited
- Fund Moneta Markets account with a minimum of $250
- Opt in using the form to claim your 50% deposit bonus
Learn to Trade
Never Miss A Trade Again

Signal Notification
Real-time signal notifications whenever a signal is opened, closes or Updated

Get Alerts
Immediate alerts to your email and mobile phone.

Entry Price Levels
Entry price level for every signal Just choose one of our Top Brokers in the list above to get all this free.