US30 Analysis – October 14
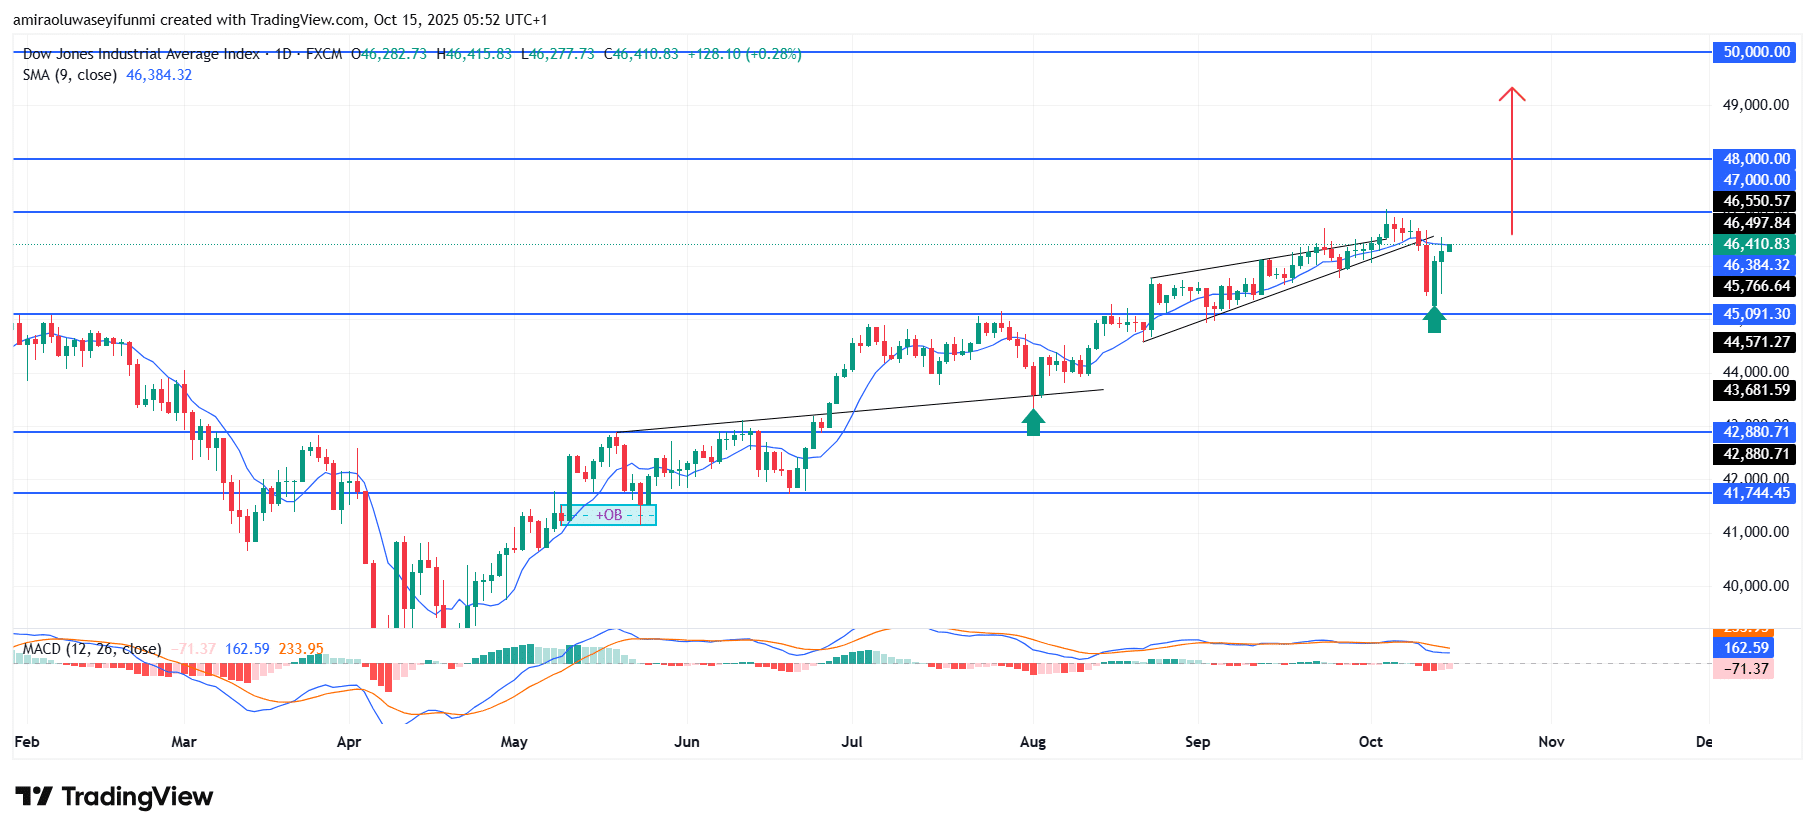
US30 regains upward momentum after a liquidity sweep. The US30 Index has reestablished its bullish stance following a strong recovery from the recent sell-side liquidity grab around the $45,090 zone. The index rebounded decisively above the 9-day SMA near $46,380, indicating renewed buying pressure and sustained market optimism. The MACD also confirms this positive sentiment, with a fresh bullish crossover signaling that buyers are regaining short-term control. These technical confirmations highlight a solid resurgence in demand and reflect sustained investor confidence within the broader equity market.
US30 Key Levels
Resistance Levels: $47000, $48000, $50000
Support Levels: $45090, $42880, $41740
US30 Long-Term Trend: Bullish
From a broader technical standpoint, price action shows a strong rebound from the $45,090 support region, which served as a key liquidity point for renewed accumulation. The index has regained higher ground after testing previous structural lows, suggesting effective liquidity absorption by institutional buyers. The presence of a bullish engulfing candle post-reversal strengthens this bias, while the formation of successive higher lows reinforces a renewed bullish structure toward key resistance zones.
Looking ahead, continued bullish momentum could propel the index toward the $46,500–$47,000 range in the near term, with potential upside extension to $48,000 if buying interest persists. A confirmed break above $47,000 would validate strong bullish control and set the stage for a move toward the $50,000 psychological level. As long as price sustains above $45,700, the broader market bias remains upward, with medium-term projections pointing to a steady appreciation in value through Q4. Traders monitoring forex signals may also find these developments useful for aligning with the prevailing bullish sentiment.
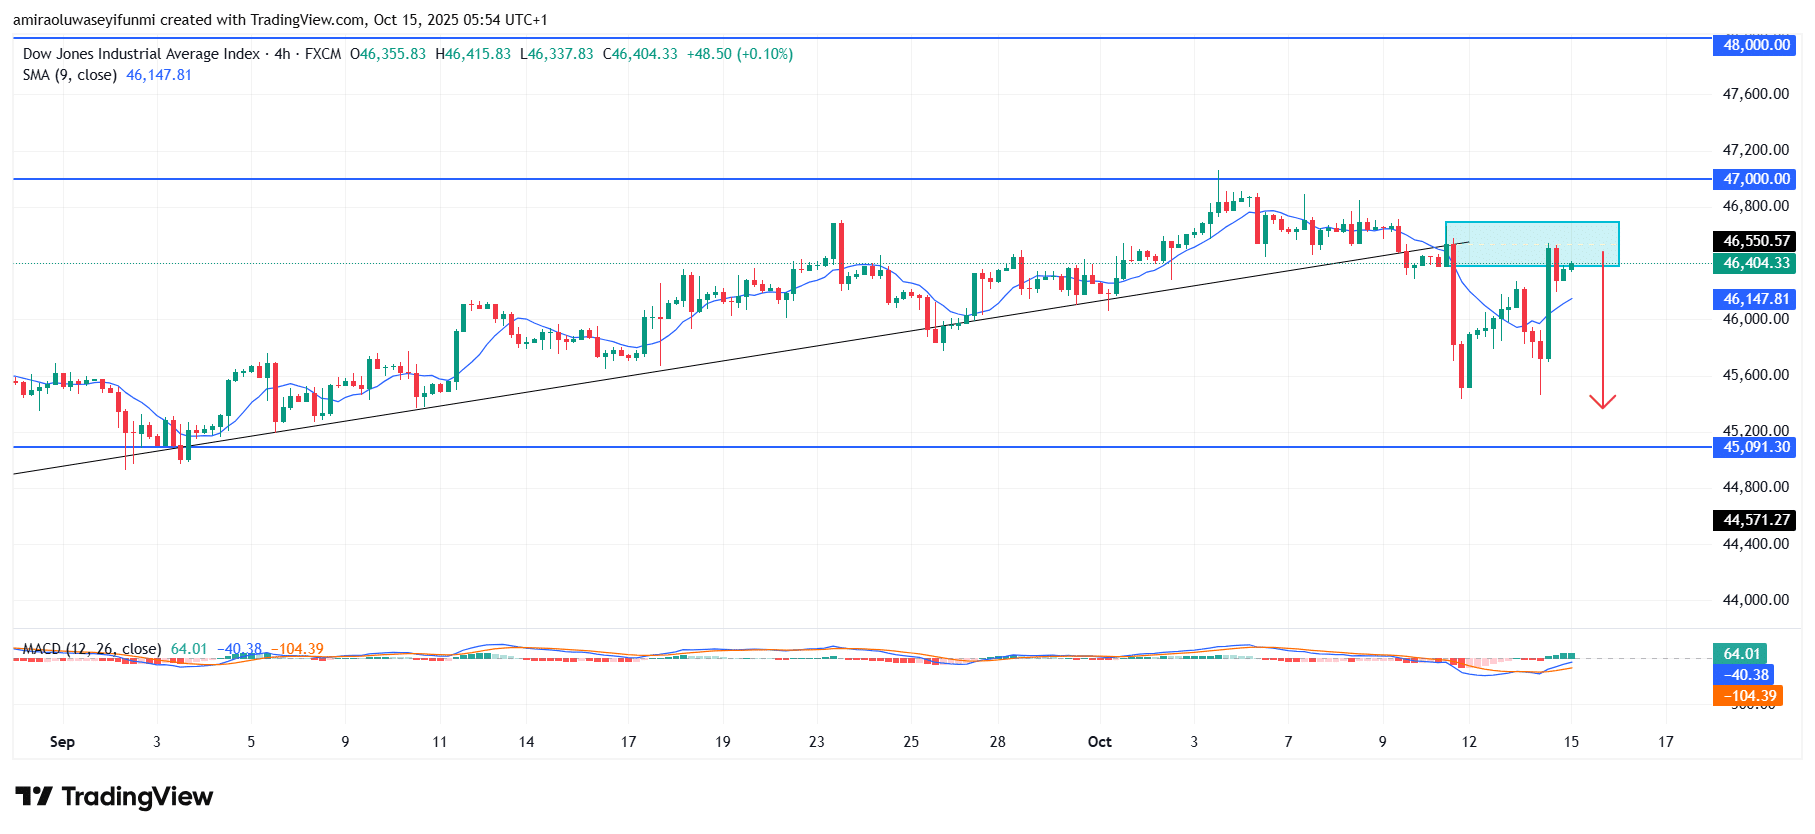
US30 Short-Term Trend: Bearish
US30 is currently experiencing short-term bearish pressure after failing to maintain momentum above the $46,550 resistance level. The rejection from this zone, along with fading strength near the 9-period SMA around $46,150, suggests a potential short-term retracement.
MACD readings indicate waning bullish energy, hinting at a possible reentry of sellers into the market. If downward momentum persists, price could retreat toward the $45,090 support region before buyers attempt another recovery.
Make money without lifting your fingers: Start using a world-class auto trading solution
How To Buy Lucky Block
Note: Learn2.trade is not a financial advisor. Do your research before investing your funds in any financial asset, product, or event. We are not responsible for your investment results.
- Broker
- Min Deposit
- Score
- Visit Broker
- Award-winning Cryptocurrency trading platform
- $100 minimum deposit,
- FCA & Cysec regulated
- 20% welcome bonus of upto $10,000
- Minimum deposit $100
- Verify your account before the bonus is credited
- Fund Moneta Markets account with a minimum of $250
- Opt in using the form to claim your 50% deposit bonus
Learn to Trade
Never Miss A Trade Again

Signal Notification
Real-time signal notifications whenever a signal is opened, closes or Updated

Get Alerts
Immediate alerts to your email and mobile phone.

Entry Price Levels
Entry price level for every signal Just choose one of our Top Brokers in the list above to get all this free.


