US30 Analysis – October 7
US30 sustains upward momentum amid a strong technical structure. The US30 index continues to display a robust bullish trajectory, maintaining consistent alignment with upward-trending indicators. Price remains well above the 9-day Simple Moving Average (SMA) near $46,440, reflecting sustained investor confidence and persistent buying interest. The MACD histogram also maintains positive readings, with the signal line confirming continued bullish strength. Overall sentiment remains constructive, supporting the prevailing upward bias across broader market conditions.
US30 Key Levels
Resistance Levels: $47,000, $48,000, $50,000
Support Levels: $45,090, $42,880, $41,740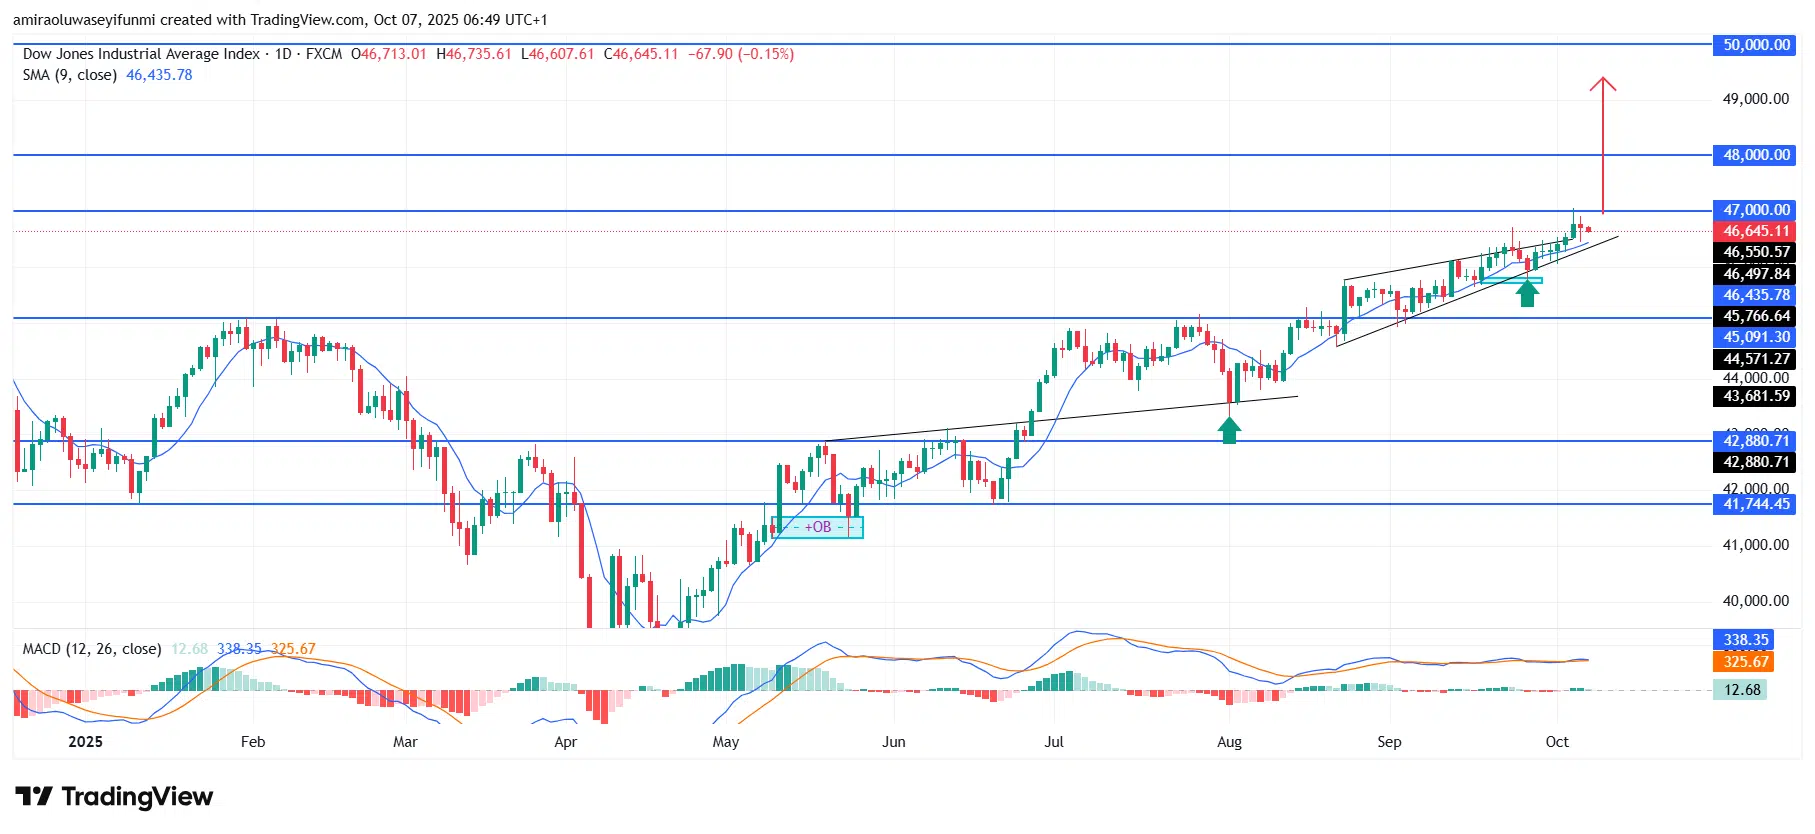
US30 Long-Term Trend: Bullish
From a technical perspective, price action has consistently respected the ascending channel since mid-June, forming a pattern of higher highs and higher lows. The index has shown resilience at each retest of the dynamic trendline support—particularly around $45,090 and $46,000—where buyers have repeatedly reestablished control. The recent breakout above $46,550 indicates strong continuation of the bullish move, as the market consolidates around former resistance turned support near $46,500, reaffirming the integrity of the bullish structure.
Looking forward, if price sustains momentum above the $46,500–$46,700 range, the next potential target lies at $48,000, marking a significant resistance level. A sustained move beyond this threshold could pave the way toward $50,000, aligning with institutional buying trends and prevailing macroeconomic optimism. However, a failure to maintain price above $46,400 could prompt a short-term pullback before resuming the upward move. Overall, the medium-term bias remains firmly bullish.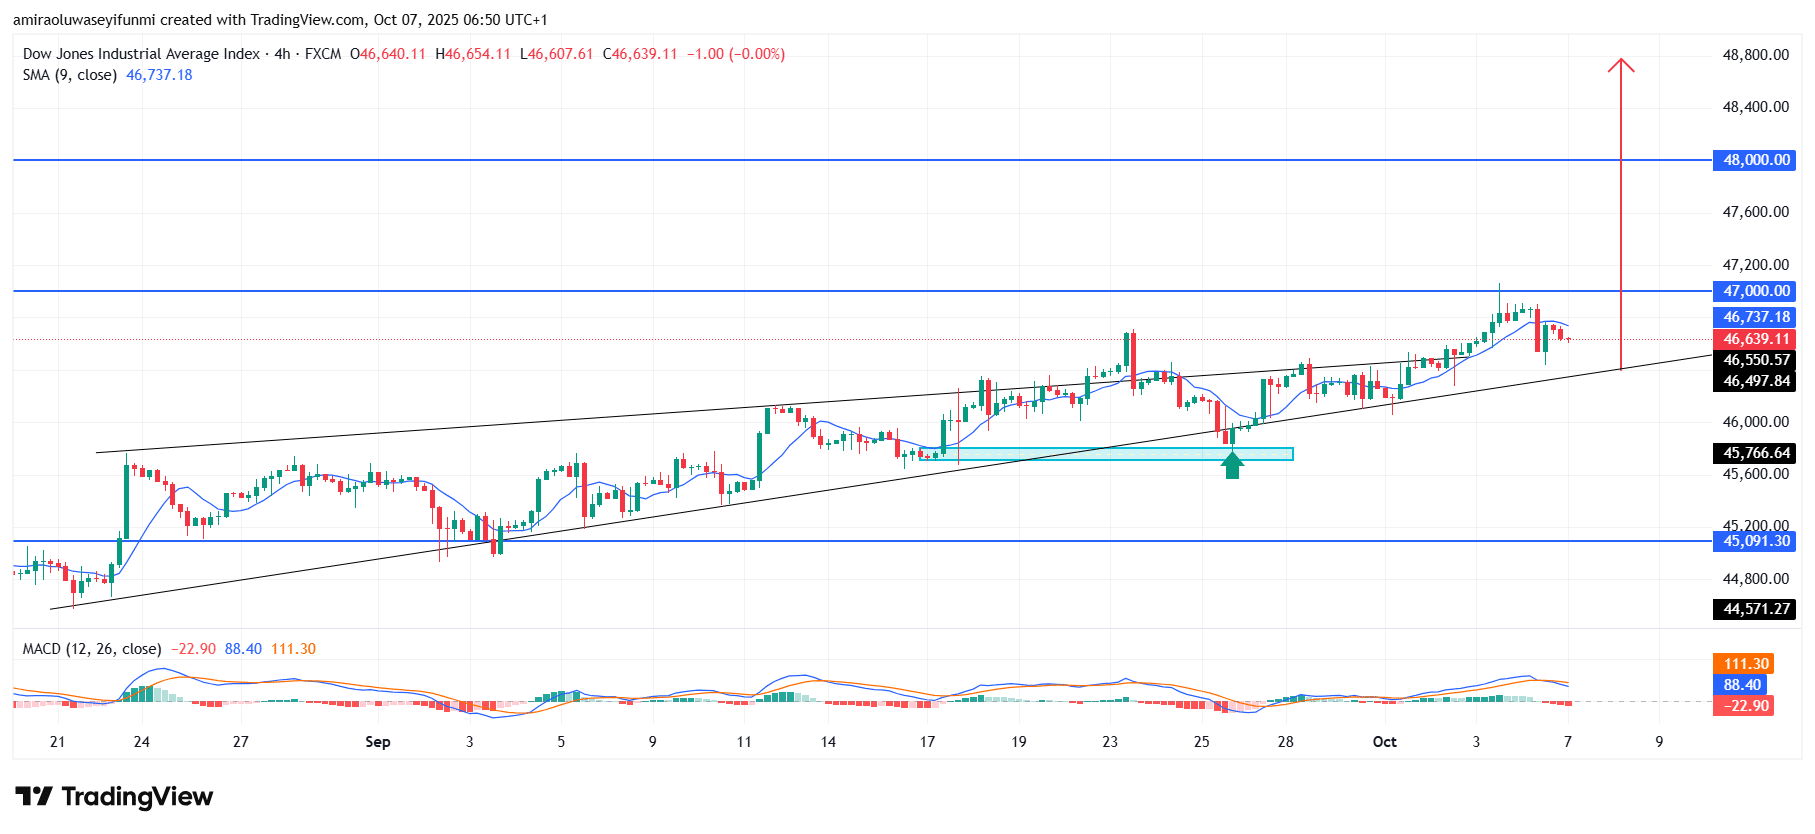
US30 Short-Term Trend: Bullish
US30 maintains its bullish outlook on the four-hour chart as price continues to trade above the ascending trendline and the 9-day SMA near $46,740. The recent pullback appears corrective, holding firm above $46,500 support, where buyers have repeatedly stepped in to stabilize momentum.
The MACD remains positive despite minor histogram contraction, suggesting that momentum continues to favor the upside. Traders monitoring forex signals may anticipate a decisive breakout above $47,000, which could accelerate price action toward the $48,000 resistance zone in the next bullish phase.
Make money without lifting your fingers: Start using a world-class auto trading solution
How To Buy Lucky Block
Note: Learn2.trade is not a financial advisor. Do your research before investing your funds in any financial asset, product, or event. We are not responsible for your investment results.
- Broker
- Min Deposit
- Score
- Visit Broker

- Award-winning Cryptocurrency trading platform
- $100 minimum deposit,
- FCA & Cysec regulated

- 20% welcome bonus of upto $10,000
- Minimum deposit $100
- Verify your account before the bonus is credited
- Fund Moneta Markets account with a minimum of $250
- Opt in using the form to claim your 50% deposit bonus
Learn to Trade
Never Miss A Trade Again

Signal Notification
Real-time signal notifications whenever a signal is opened, closes or Updated

Get Alerts
Immediate alerts to your email and mobile phone.

Entry Price Levels
Entry price level for every signal Just choose one of our Top Brokers in the list above to get all this free.