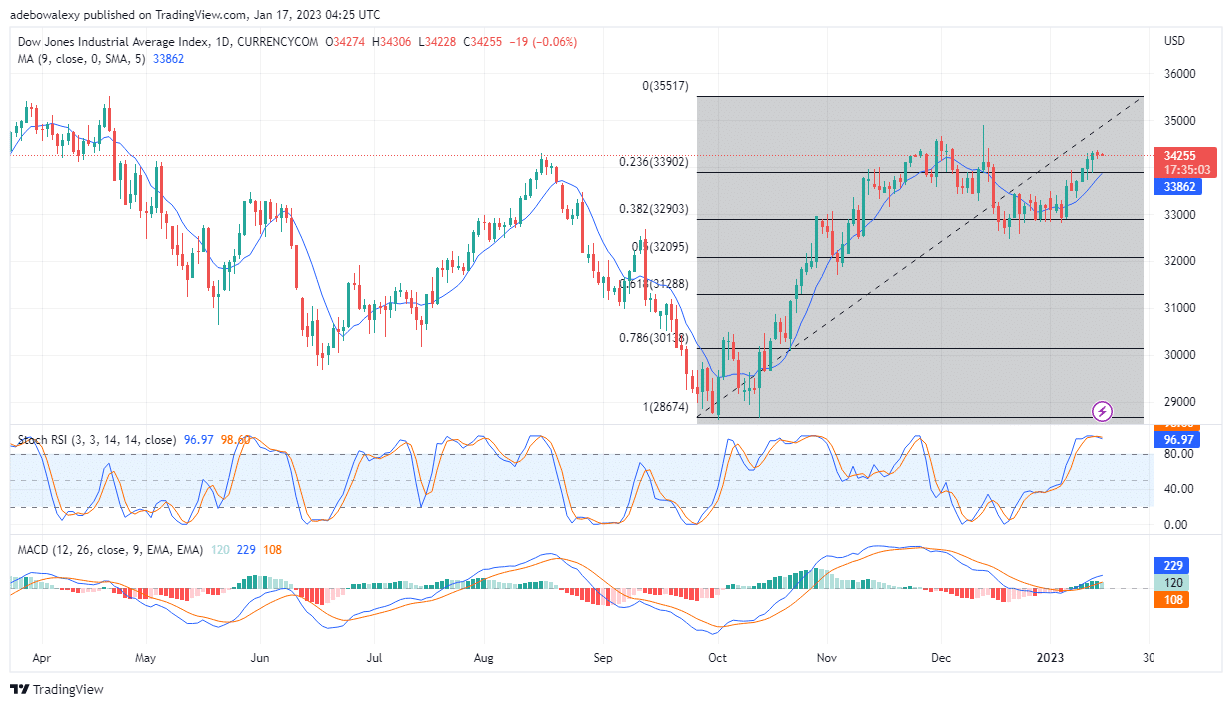
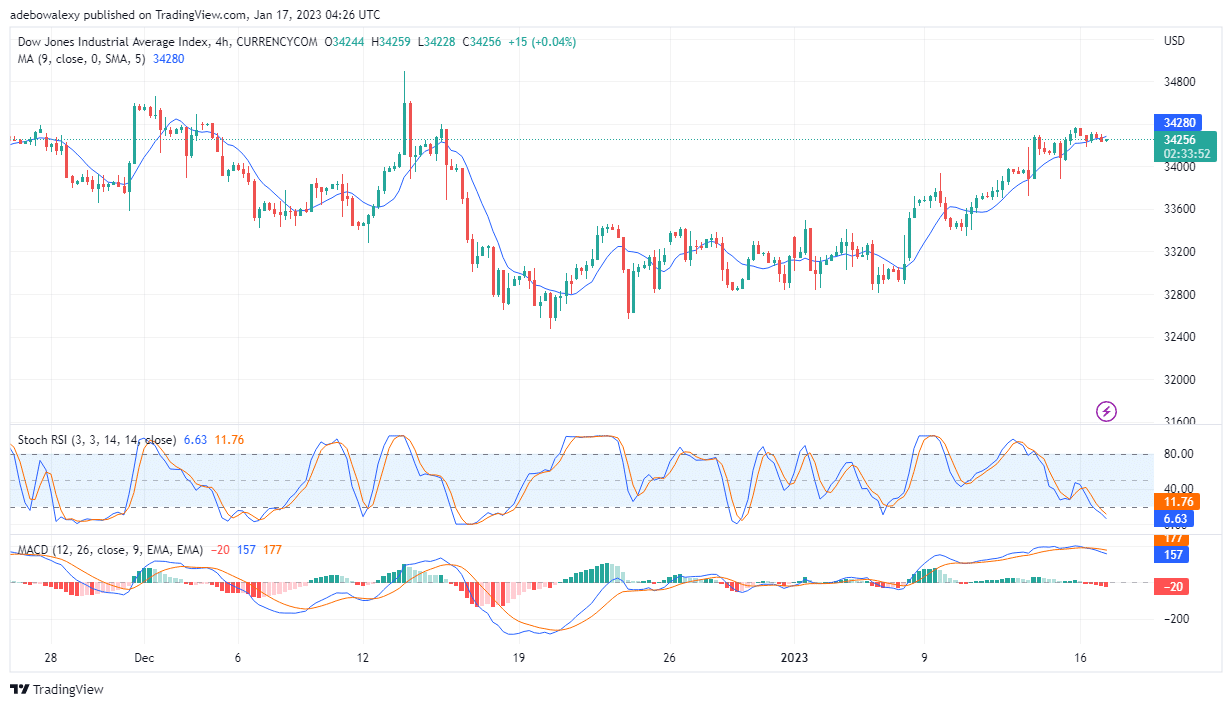
Price action in the US30 market is weakening after it successfully broke through the resistance of $33,902. And, since the previous trading session, the bears have been winning, although with low magnitudes. Let’s look into what may likely happen as trading activities progress.
Major Price Levels:
Top Levels: $34,300, $34,350, $34,400
Floor Levels: $34,255, $34,200, $34,150

US30 Price May Retrace the Support $34,100
On the daily chart for the US30, price action appears to be retracing lower price levels. The last two price candles on this chart are all red, revealing the activities of headwinds. The latest price candle, which represents the ongoing trading session, is small but may grow bigger and plunge prices lower as trading continues. The Stochastic RSI curve remains in the overbought zone but looks more like it’s already making its way downwards. Meanwhile, the MACD curves have already risen above the equilibrium level, however, the last histogram bar of this indicator is now pale green. Consequently, this is indicating a reduction in upside momentum. Although things appear to be developing, traders in this market can prepare to see the US30 price fall lower.

US30 Price Action Is Trying to Resist Headwinds
On the 4-hour chart, after the price action has crossed below the 9-day Moving Average, it appears the bulls have started mounting resistance. The last price candlestick here is green, which may be hinting that the bulls may not be out after all. However, the RSI curves have fallen so quickly into the oversold region. With careful observation, one may notice that the RSI seems a bit too sensitive. Additionally, the MACD lines are moving slightly downwards after they gave a crossover above the equilibrium level. The US30 price may fall to around $34,180 based on the majority of the signals from the applied trading indicators.
Do you want to take your trading to the next level? Join the best platform for that here.
- Broker
- Min Deposit
- Score
- Visit Broker
- Award-winning Cryptocurrency trading platform
- $100 minimum deposit,
- FCA & Cysec regulated
- 20% welcome bonus of upto $10,000
- Minimum deposit $100
- Verify your account before the bonus is credited
- Fund Moneta Markets account with a minimum of $250
- Opt in using the form to claim your 50% deposit bonus
Learn to Trade
Never Miss A Trade Again

Signal Notification
Real-time signal notifications whenever a signal is opened, closes or Updated

Get Alerts
Immediate alerts to your email and mobile phone.

Entry Price Levels
Entry price level for every signal Just choose one of our Top Brokers in the list above to get all this free.


