US30 Analysis – November 4
US30 faces short-term corrective pressure amid weak momentum. The US30 index is beginning to show early signs of fatigue after sustaining a prolonged rally toward the $48,000 region. Momentum indicators, particularly the RSI hovering around 65, point to a gradual slowdown in buying strength, while the 9-day Simple Moving Average, positioned near $47,380, shows a narrowing distance from current price levels. Although the broader market remains bullish, short-term technical readings suggest a likely corrective phase as buyers lose traction near key resistance zones.
US30 Key Levels
Resistance Levels: $48000, $50000, $51000
Support Levels: $45090, $42880, $41740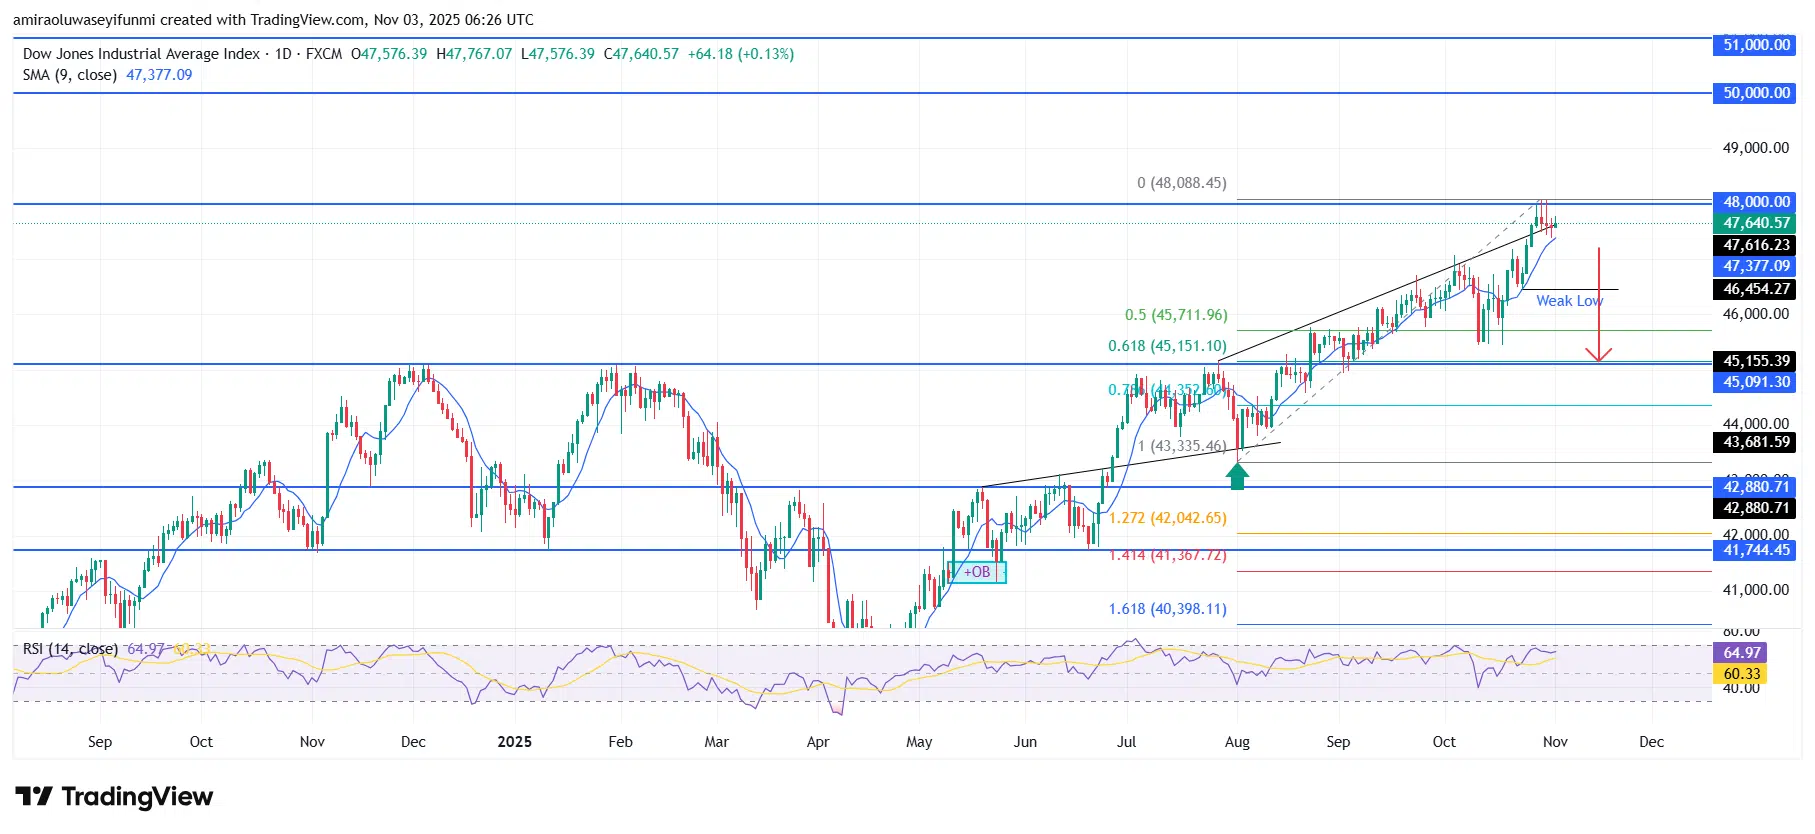
US30 Long-Term Trend: Bullish
From a technical standpoint, price recently tested a critical resistance area around $48,000 before encountering mild rejection and forming a weak low near $46,450. The ascending channel that has guided recent price movement now shows signs of strain, with price struggling to sustain momentum above its upper boundary. This structural shift suggests a potential correction from the current wedge formation, supported by waning bullish volume and a probable retest of key Fibonacci retracement zones between $45,150 and $45,710.
In the near term, a pullback toward the $45,100–$45,700 range appears likely as the index seeks balance following its extended advance. A clear break below $45,000 could trigger deeper declines toward $43,700 or even $42,880, aligning with prior support clusters. However, any rebound from these zones may offer temporary relief before renewed selling pressure sets in, sustaining short-term bearish sentiment. Traders can leverage insights from forex signals to identify potential turning points during this corrective movement and manage risk more effectively.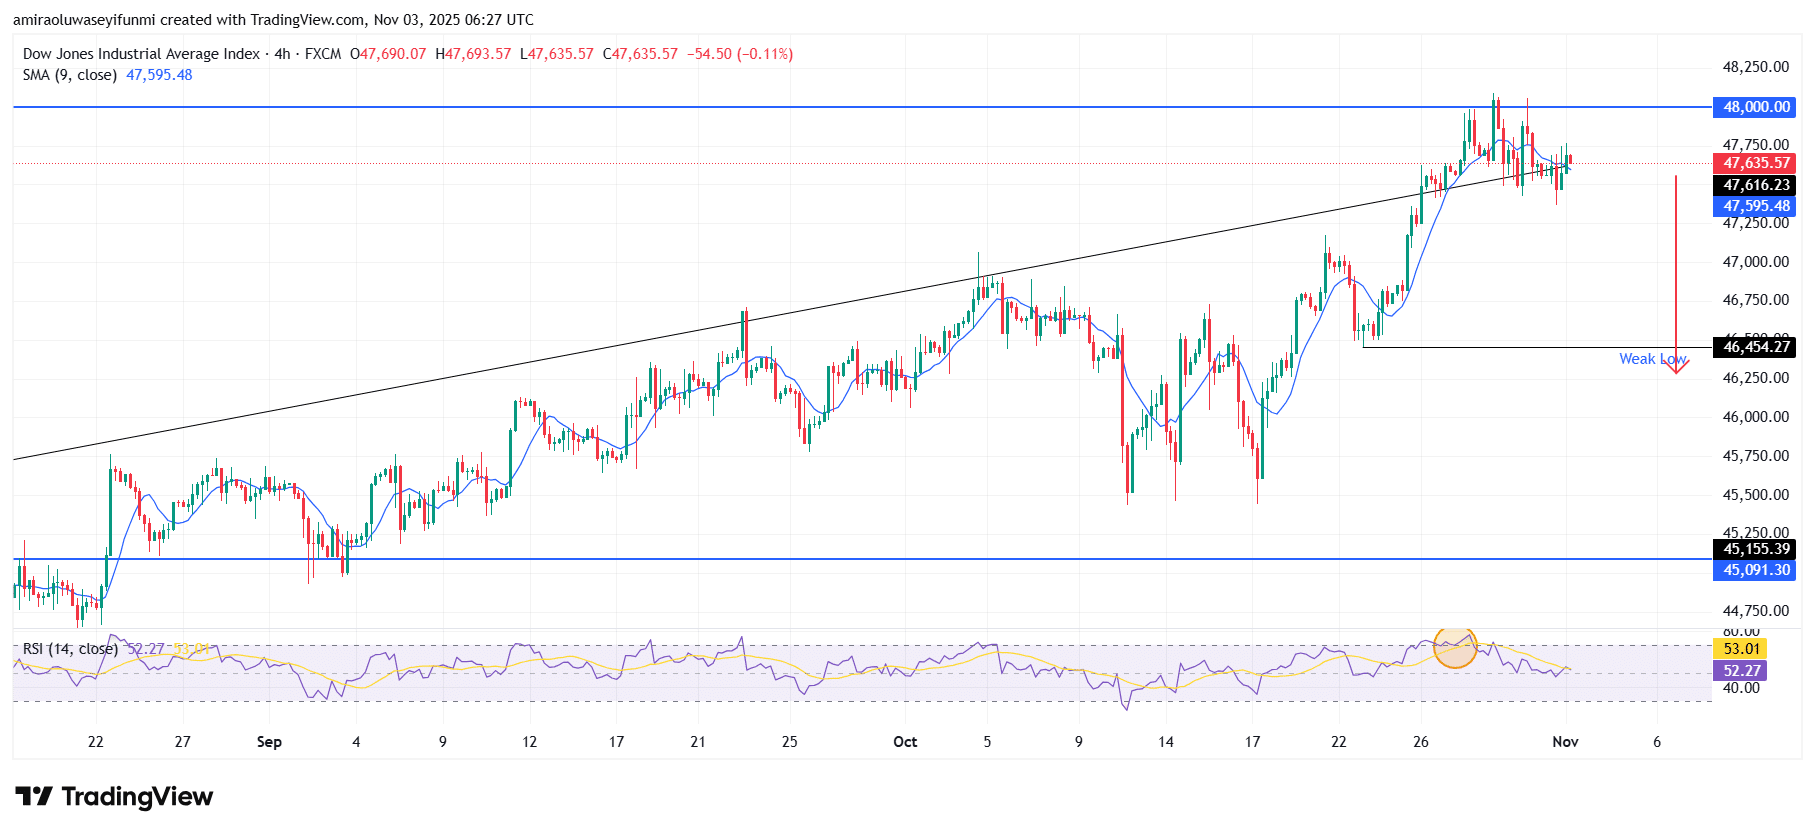
US30 Short-Term Trend: Bearish
US30 is exhibiting bearish pressure on the four-hour chart after failing to hold above the $48,000 resistance area. Price has slipped below the ascending trendline, indicating weakening bullish momentum. The RSI has turned downward from mid-levels, confirming diminishing buying interest. A further drop toward the weak low at $46,450 remains probable if sellers maintain dominance.
Make money without lifting your fingers: Start using a world-class auto trading solution
How To Buy Lucky Block
Note: Learn2.trade is not a financial advisor. Do your research before investing your funds in any financial asset, product, or event. We are not responsible for your investment results.
- Broker
- Min Deposit
- Score
- Visit Broker

- Award-winning Cryptocurrency trading platform
- $100 minimum deposit,
- FCA & Cysec regulated

- 20% welcome bonus of upto $10,000
- Minimum deposit $100
- Verify your account before the bonus is credited
- Fund Moneta Markets account with a minimum of $250
- Opt in using the form to claim your 50% deposit bonus
Learn to Trade
Never Miss A Trade Again

Signal Notification
Real-time signal notifications whenever a signal is opened, closes or Updated

Get Alerts
Immediate alerts to your email and mobile phone.

Entry Price Levels
Entry price level for every signal Just choose one of our Top Brokers in the list above to get all this free.