Bulls are becoming more active
SPONGE (SPONGEUSDT) Price Analysis – 04 November
The targets might be the resistance levels of $0.000136, $0.000330, and $1,786 if the $0.000081 level holds. The support levels of $0.000006 and $0.000004 can be tested if the bearish trend breaches the $0.000081 level.
SPONGEUSDT Market
Key levels:
Resistance levels: $0.000136, $0.000196, $$0.000330
Support levels: $0.000081, $0.000006, $0.000004
SPONGEUSDT Long-term Trend: Bullish
It looks like Sponge has a promising future. Consumers aren’t yet worn out. Because of consumer demand, sponge prices are rising. On September 6, the $0.000136 resistance level was not maintained. The number of bullish candles increased daily. At $0.000136, the price exceeded a critical pricing threshold. Last week, the price moved back and forth between the indicated resistance levels. In an effort to draw in additional investors, sellers stepped up their pressure and broke the level toward the conclusion of the week. At the moment, buyers are applying greater pressure and searching for the $0.000136 threshold.
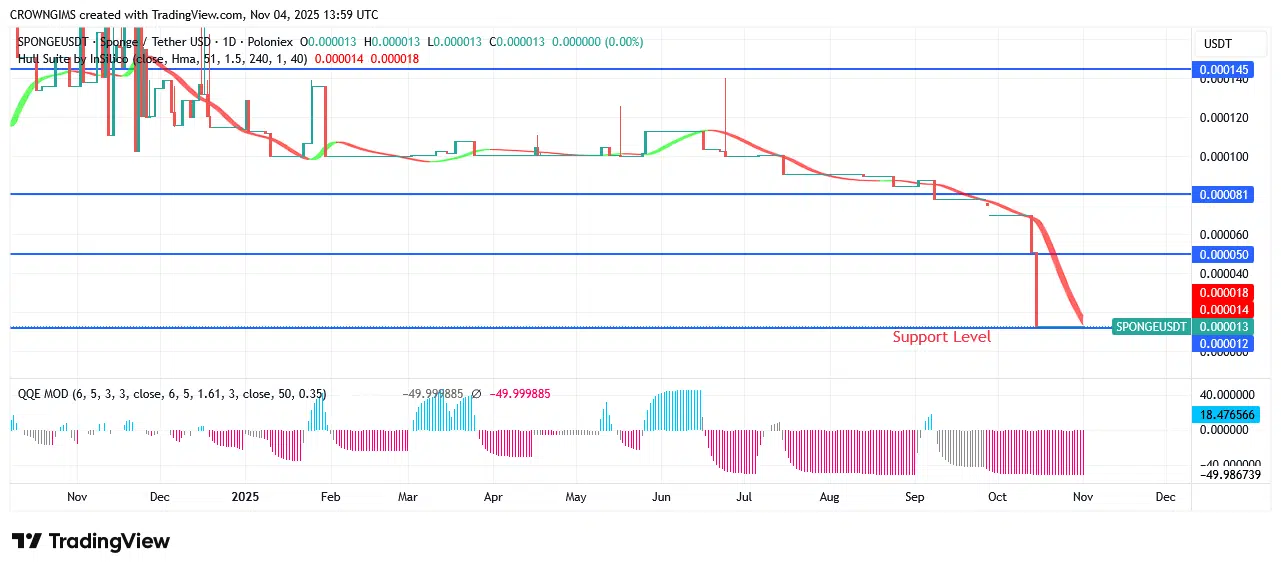
The price trading above and the Hull Suite crypto signaling indicator both demonstrate how well the Sponge market is performing. The targets might be the resistance levels of $0.000136, $0.000330, and $1,786 if the $0.000081 level holds. The support levels of $0.000006 and $0.000004 can be tested if the bearish trend breaches the $0.000081 level.
SPONGEUSDT Medium-term Trend: Bullish
For four hours, the Sponge chart may show a positive trend. The selling disturbance did not cause a bearish market reversal. The bulls’ pressure doesn’t seem to have been lifted at the previously suggested resistance level yet. On October 14th, strong bullish candles formed, indicating that buyers are gaining ground. After breaking through the $0.000136 barrier, the price will rise to roughly $0.000196.