US30 Analysis – September 16
US30 faces a short-term correction amid broader uptrend resilience. The index recently showed signs of exhaustion after a sustained bullish rally, with price consolidating just below resistance at $46,210. The RSI, currently around 59, signals fading momentum but not yet an overbought condition. Meanwhile, the 9-day SMA at $45,688 offers immediate dynamic support, suggesting the market is in a transitional phase rather than a complete reversal. This setup supports the likelihood of a corrective pullback in the near term.
US30 Key Levels
Resistance Levels: $46,210, $47,000, $48,000
Support Levels: $42,880, $41,740, $38,400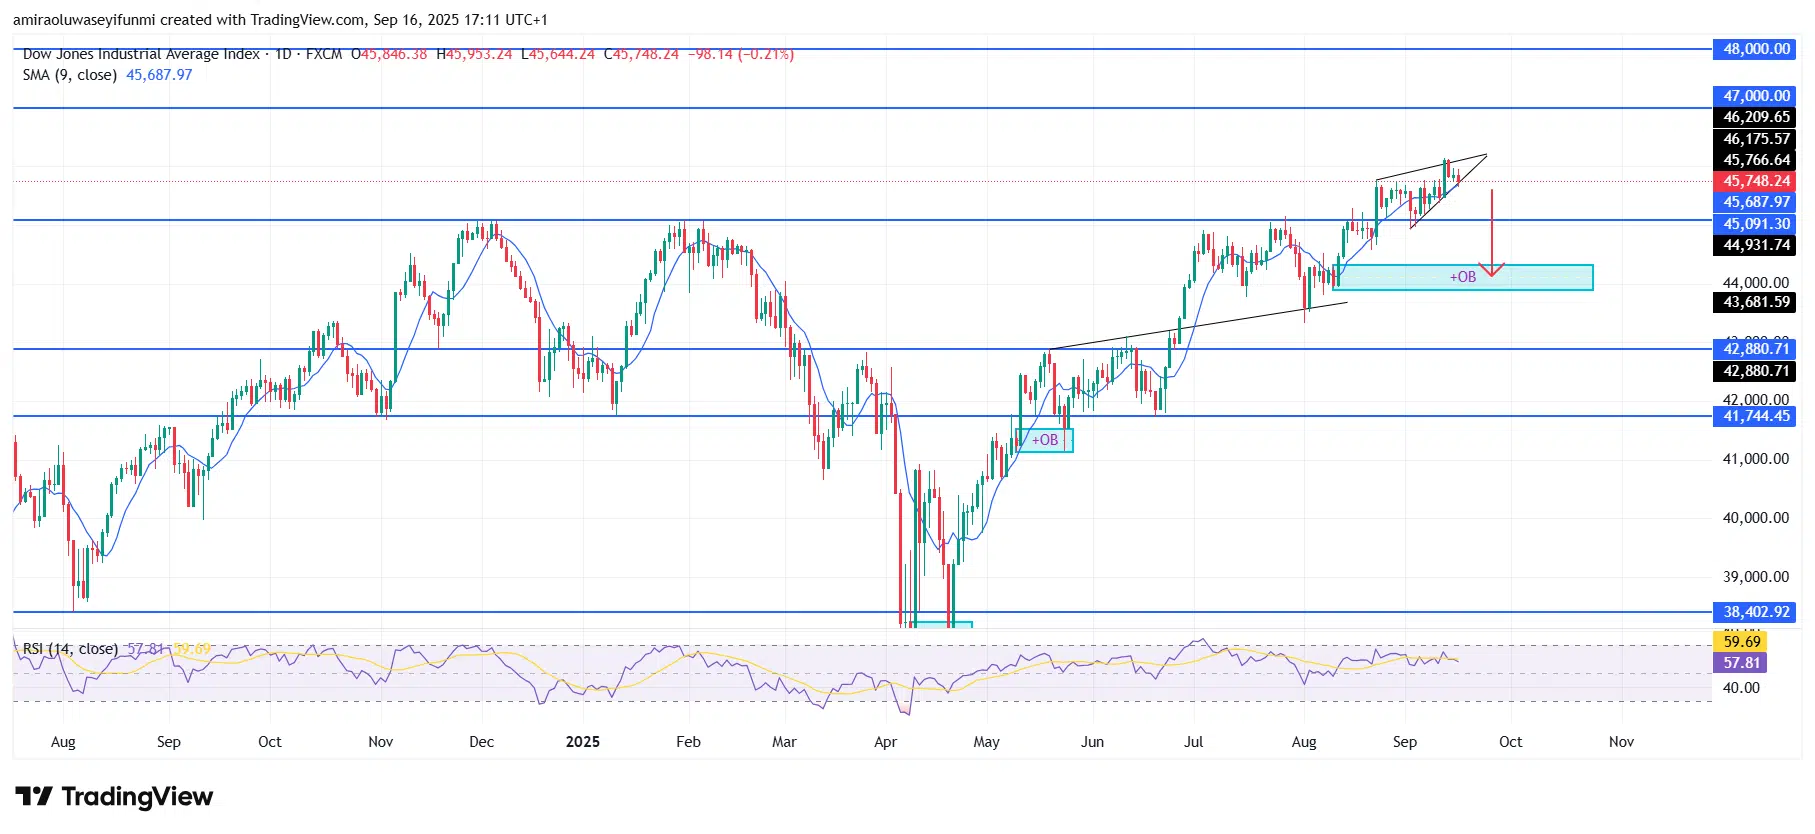
US30 Long-Term Trend: Bullish
From a technical perspective, price action is forming a rising wedge pattern, a setup that often signals weakness after a sharp upward move. The rejection just below $46,210 underscores the presence of sellers at higher levels, while immediate downside pressure points toward support near $45,090. A break below this level could trigger a deeper decline into the demand zone between $44,930 and $43,680, where previous bullish reactions have occurred.
Looking ahead, the market is likely to retrace toward the $44,930–$43,680 zone before attempting a recovery. If buyers successfully defend this area, momentum could rebuild for another move toward the $46,210–$47,000 resistance range. However, failure to hold $43,680 would shift focus to the next significant support at $42,880, deepening the correction. Overall, while the short-term view leans bearish, the broader trend remains aligned with a potential continuation toward $47,000 and even $48,000.
US30 Short-Term Trend: Bearish
US30 shows weakness on the four-hour chart as price continues to form a rising wedge near $45,770. The RSI has turned lower from mid-levels, confirming waning bullish momentum.
Immediate support lies at $45,090, and a break below this level could expose the demand zone between $44,930 and $43,680. As long as price remains capped below $46,210, the short-term bias favors continued downside. Traders can use forex signals to monitor potential entries and exits during this corrective phase.
Make money without lifting your fingers: Start using a world-class auto trading solution
How To Buy Lucky Block – Guide, Tips & Insights | Learn 2 Trade
Note: Learn2.trade is not a financial advisor. Do your research before investing your funds in any financial asset, product, or event. We are not responsible for your investment results.
- Broker
- Min Deposit
- Score
- Visit Broker

- Award-winning Cryptocurrency trading platform
- $100 minimum deposit,
- FCA & Cysec regulated

- 20% welcome bonus of upto $10,000
- Minimum deposit $100
- Verify your account before the bonus is credited


- Fund Moneta Markets account with a minimum of $250
- Opt in using the form to claim your 50% deposit bonus