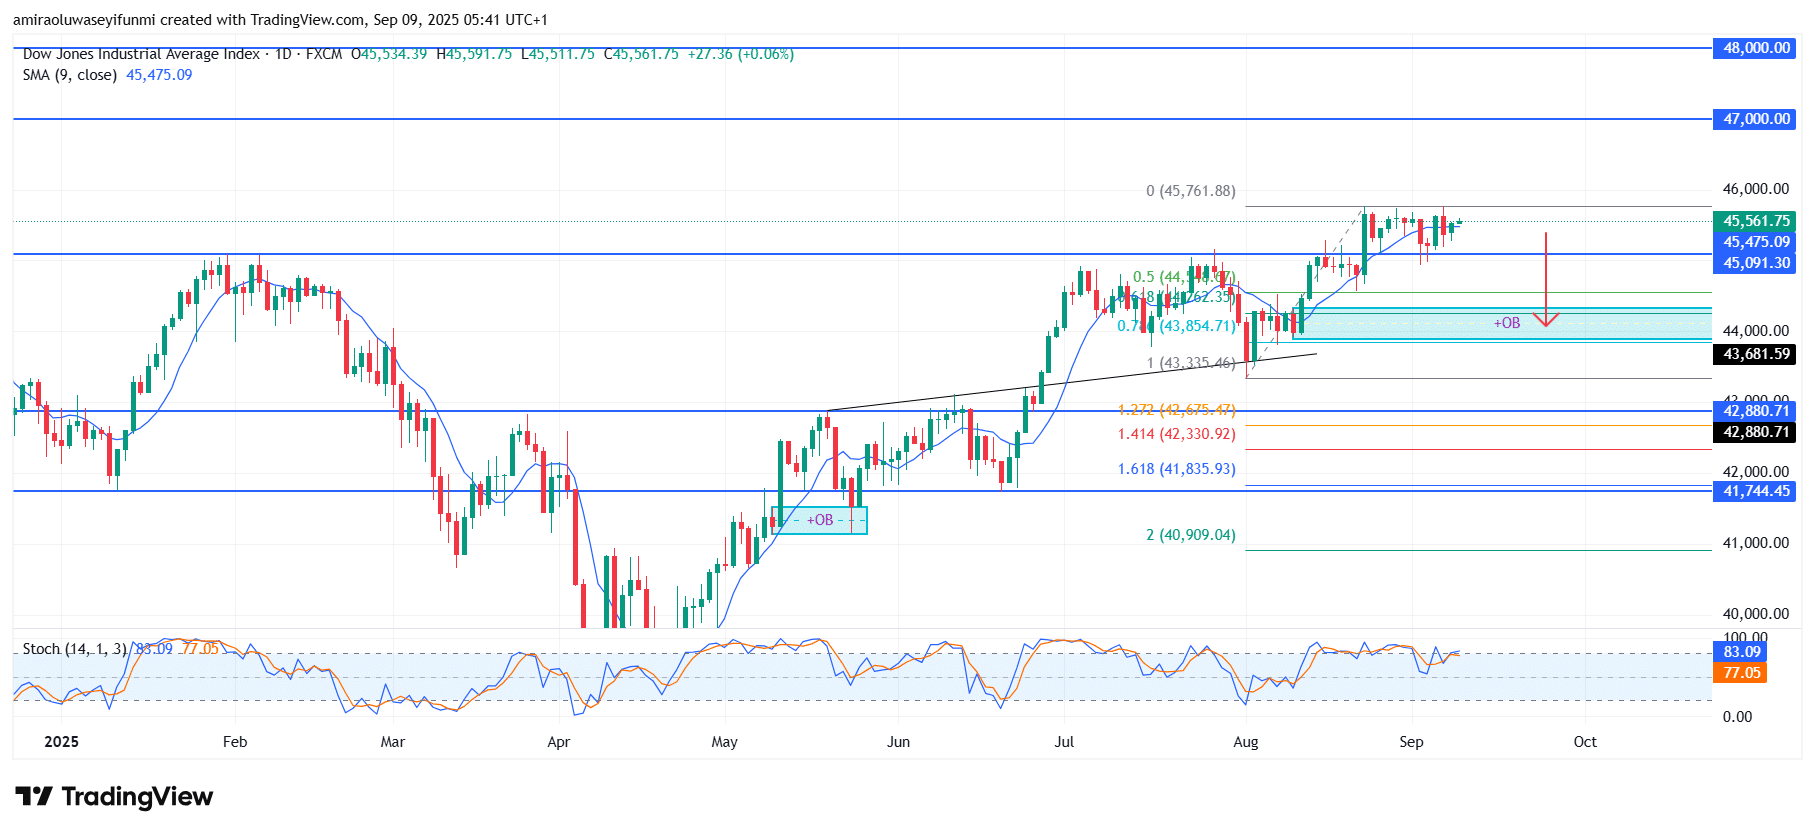
US30 faces a corrective downturn under medium term selling pressure. The US30 index is showing signs of a corrective phase as momentum indicators point to cooling after recent highs near $45,760. The daily Stochastic Oscillator is positioned in the overbought region, signaling weakening upside strength. The 9-day SMA at $45,475 is acting as a near-term pivot, but the broader setup suggests exhaustion in bullish momentum. This alignment highlights the market’s gradual shift toward a medium-term bearish posture.
US30 Key Levels
Resistance Levels: $45,760, $47,000, $48,000 Support Levels: $42,880, $41,740, $40,910
US30 Long-Term Trend: Bullish
Technically, price action has struggled to establish a sustained breakout above $45,760 and is instead consolidating beneath this resistance. The rejection has created room for sellers to test support levels around $45,100 and possibly extend toward $44,180. A significant liquidity cluster lies in the $44,000 region, marked by earlier order blocks and Fibonacci retracement zones, which could serve as the first strong demand base. Sustained closes below $45,100 would confirm the developing bearish structure.
Looking ahead, US30 risks a gradual pullback into the $43,680–$42,880 corridor if bearish pressure intensifies. Failure of this zone to hold could trigger further retracement toward $41,840, aligning with the 1.618 Fibonacci extension. On the other hand, any consistent recovery above $45,760 would challenge the bearish scenario, but until such a breakout occurs, the path of least resistance remains tilted lower. Medium-term sentiment currently favors sellers as capital inflows soften and technical resistance strengthens.
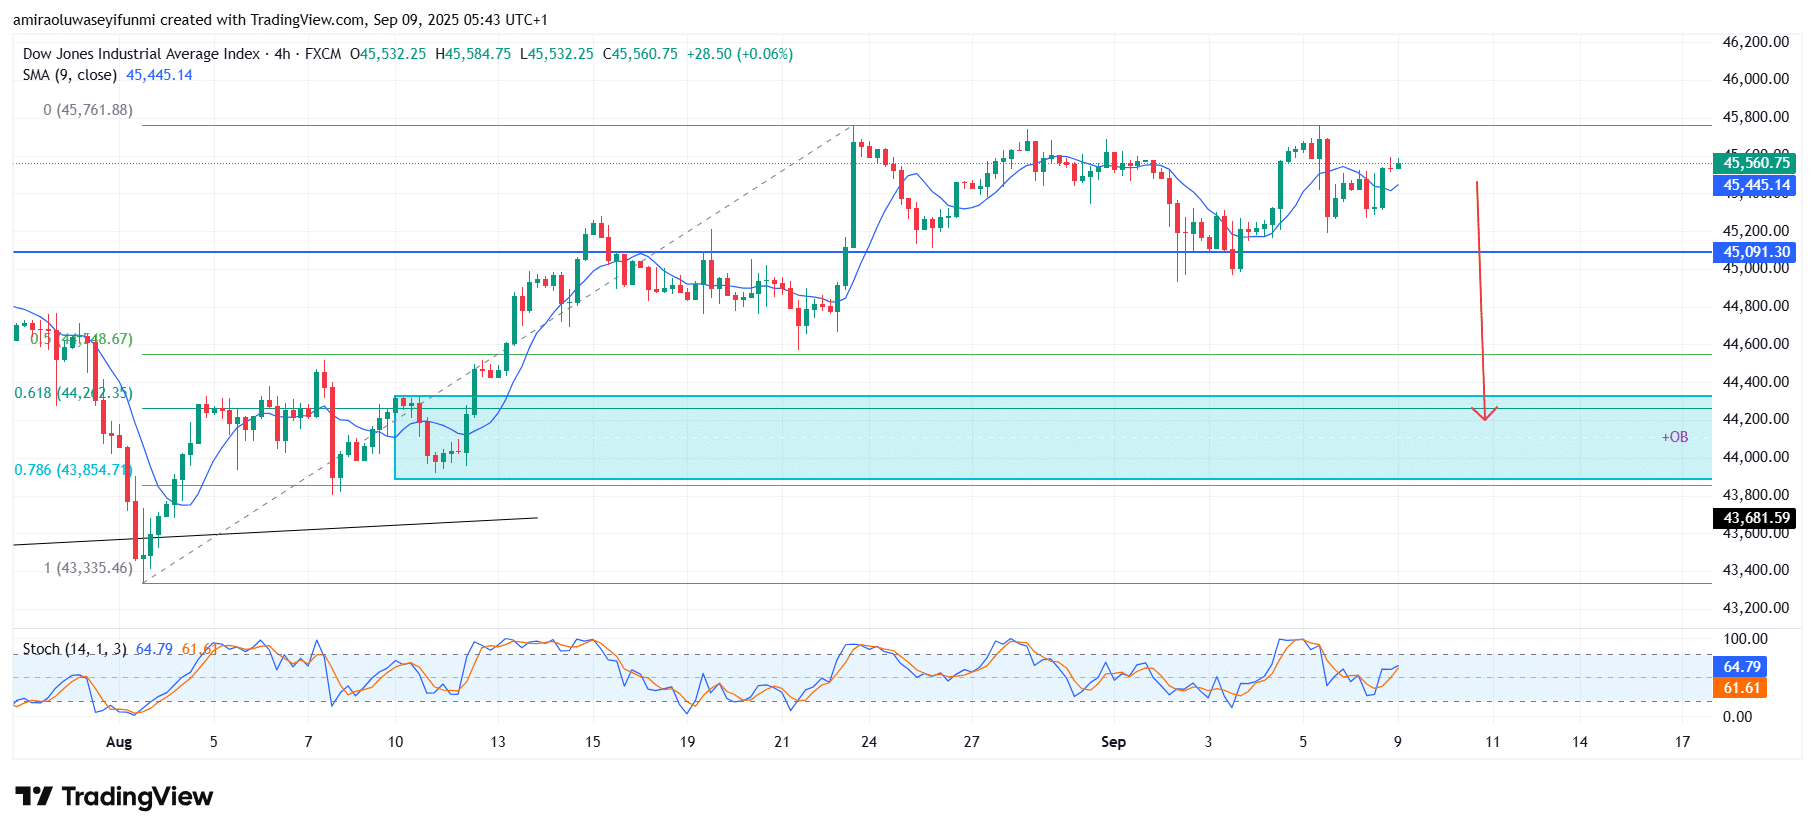
US30 Short-Term Trend: Bullish
On the four-hour chart, US30 shows weakness with resistance holding firm at $45,760. The price is trading just above $45,445, but momentum indicators are softening, reflecting growing bearish sentiment.
A break below $45,100 could accelerate downside pressure into the $44,200–$43,850 demand zone. Unless buyers reclaim higher ground, the medium-term outlook is likely to favor continued selling. This analysis illustrates how forex signals can provide valuable guidance in identifying turning points and managing risk in volatile market conditions.
Note: Learn2.trade is not a financial advisor. Do your research before investing your funds in any financial asset, product, or event. We are not responsible for your investment results.
Trade on MT4 with Leverage up to 1:500! Trade on MT4 with Leverage up to 1:500!
X
We use cookies to ensure that we give you the best experience on our website. If you continue to use this site we will assume that you are happy with it.