

US30 Analysis – September 2
US30 displays steady bullish resilience with upside potential ahead. The US30 has maintained a strong upward trajectory, consolidating above its short-term moving average near $45,450. Momentum remains favorable as the Relative Strength Index (RSI) hovers around 61, reflecting healthy buying pressure without moving into overbought conditions. The index continues to build strength around the $45,500 region, showing that market participants remain confident in sustaining the prevailing bullish sentiment.
US30 Key Levels
Resistance Levels: $45,100, $47,000, $48,000
Support Levels: $42,880, $41,740, $38,400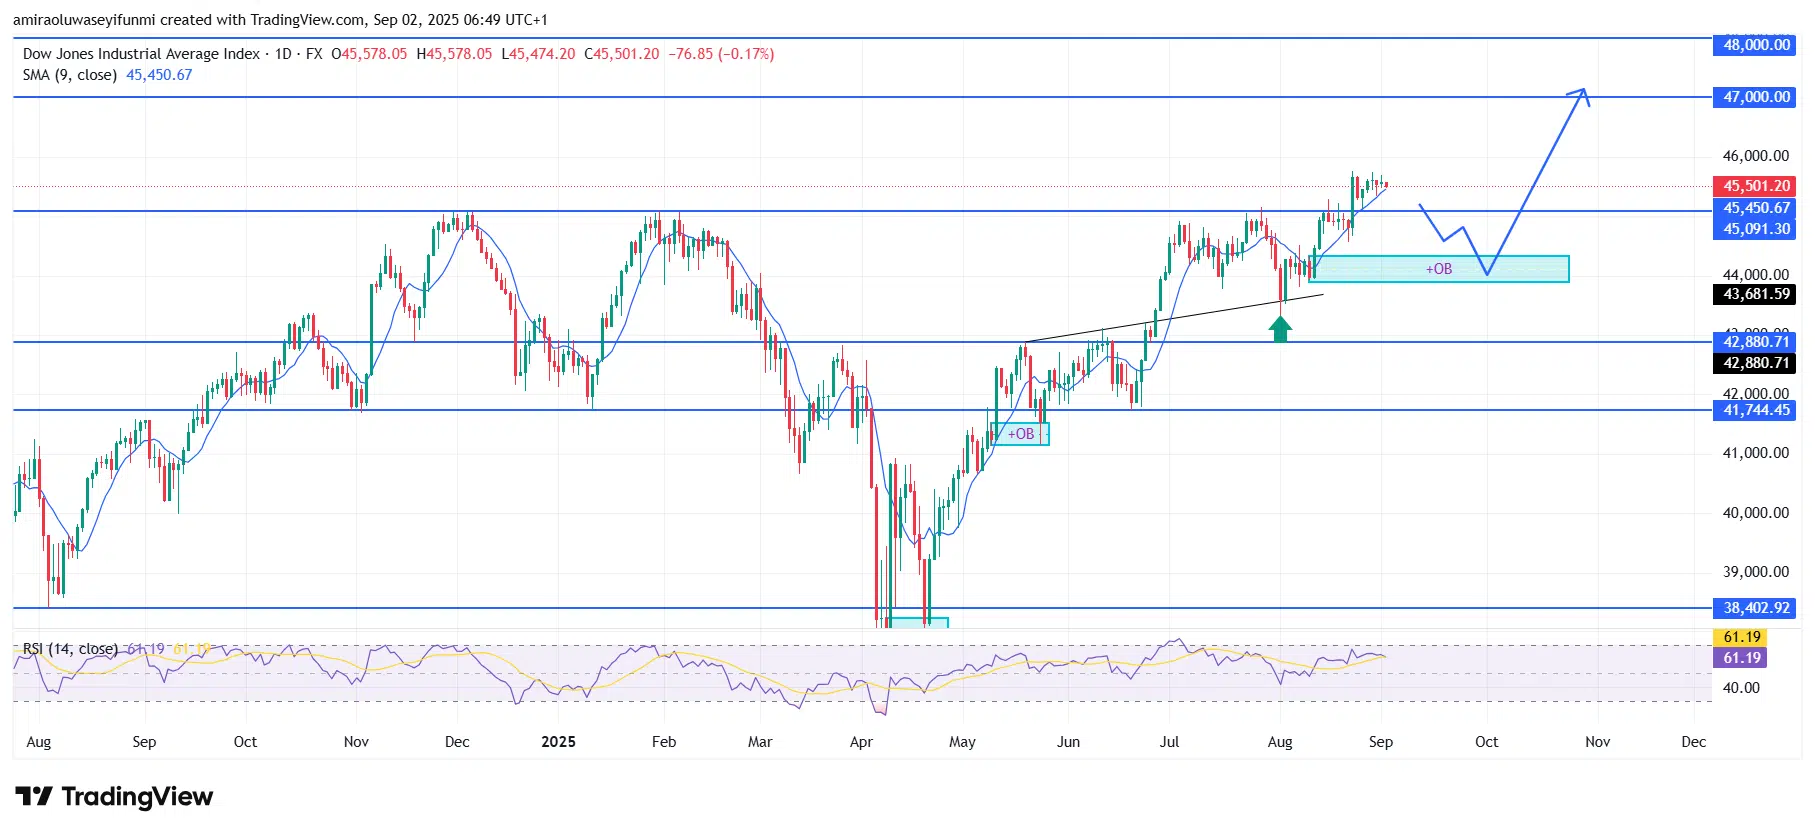
US30 Long-Term Trend: Bullish
Price action reflects a series of higher lows since mid-August, confirming the market’s bullish structure. The key support zone is near $43,680, aligning with the prior order block, while immediate resistance stands around $46,000. The market has also respected the $42,880 level during past retests, further establishing it as a pivotal demand area. Buyers remain dominant as long as the price holds above these supports, while sellers have yet to gain meaningful control.
Looking forward, US30 is positioned to extend gains toward the $47,000 level, with a possible test of $48,000 if bullish momentum strengthens. A short-term pullback into the $44,000–$43,700 demand zone would likely serve as a healthy retracement, giving new buyers an opportunity to re-enter before continuation. As long as the index remains above $42,880, the broader market outlook stays constructive, and investors should anticipate further appreciation in the weeks ahead, especially with traders seeking forex signals to guide their entries.
US30 Short-Term Trend: Bullish
US30 is showing mild weakness on the four-hour chart after failing to sustain momentum above $45,700. The RSI hovers near 51, signaling reduced buying pressure and leaving room for a downward correction. Key support lies around $44,260, aligning with the 0.618 Fibonacci retracement zone. A drop below this level could trigger stronger bearish momentum toward $43,850.
Make money without lifting your fingers: Start using a world-class auto trading solution
How To Buy Lucky Block – Guide, Tips & Insights | Learn 2 Trade
Note: Learn2.trade is not a financial advisor. Do your research before investing your funds in any financial asset, product, or event. We are not responsible for your investment results.
- Broker
- Min Deposit
- Score
- Visit Broker

- Award-winning Cryptocurrency trading platform
- $100 minimum deposit,
- FCA & Cysec regulated

- 20% welcome bonus of upto $10,000
- Minimum deposit $100
- Verify your account before the bonus is credited


- Fund Moneta Markets account with a minimum of $250
- Opt in using the form to claim your 50% deposit bonus



