US30 Analysis – April 29
US30 faces rejection amid key resistance and a bearish outlook. The US30 (Dow Jones Industrial Average) daily chart indicates a bearish bias, supported by key indicators. The price is hovering just above the 9-day Simple Moving Average (SMA) around $39,610, suggesting temporary bullish momentum. However, the Stochastic Oscillator is currently overbought at approximately 78, signaling a potential reversal or exhaustion of the upward correction. This overbought condition fits within a broader bearish context where rallies have been short-lived, implying that sellers may soon regain control.
US30 Key Levels
Resistance Levels: $40,660, $43,000, $45,100
Support Levels: $38,400, $36,500, $35,710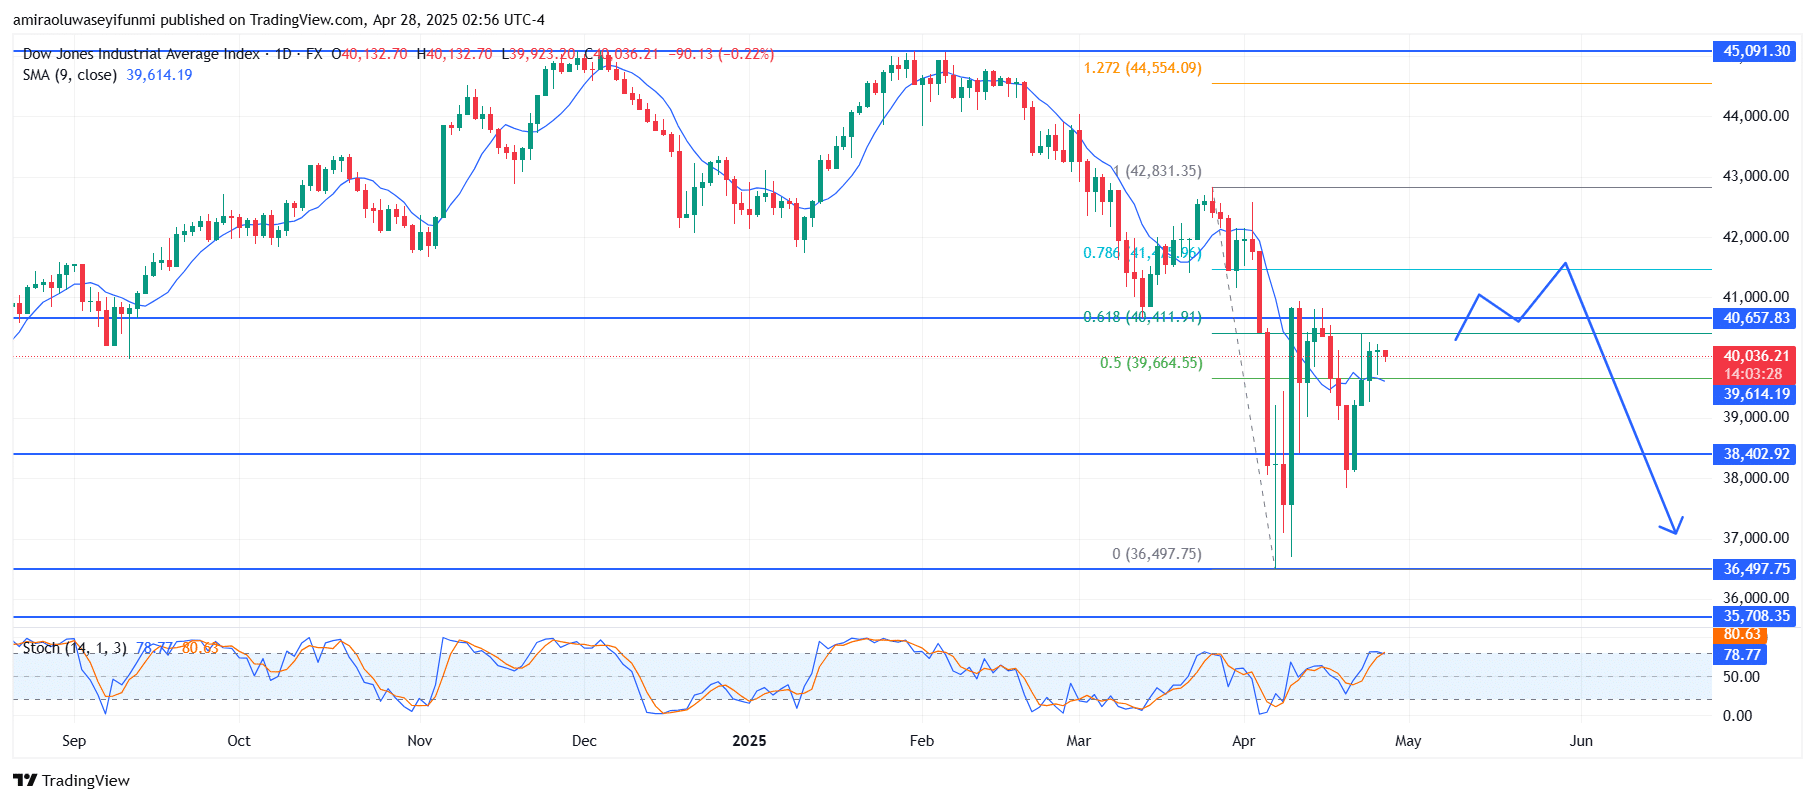
US30 Long-Term Trend: Bearish
Price action shows a strong rejection from the $42,830 level, closely aligning with the 78.6% Fibonacci retracement. Since the mid-April lows, the price has staged a recovery but has struggled to convincingly break above the $40,660 resistance area. The market formed a lower high and failed to maintain a bullish structure, with candlestick wicks indicating indecision and resistance pressure. The recent swing low around $38,400 remains a critical support area to monitor as the current consolidation unfolds below resistance.
Looking ahead, the projection leans bearish. If the price continues to face rejection around $40,660 and breaks below $39,610 (the 9-day SMA), a decline toward $38,400 is likely. If that support fails, further downside targets include $36,500 and potentially $35,710, which marks a previous support zone and psychological level. A bearish lower-high structure, combined with indicator weakness, sets the stage for a possible continuation lower, especially if macroeconomic pressures and forex signals align with this technical setup.
US30 Short-Term Trend: Bearish
US30 remains bearish on the 4-hour chart, struggling below the $40,660 resistance zone. Price is consolidating just above the 9-period SMA at $40,020, showing weak bullish momentum.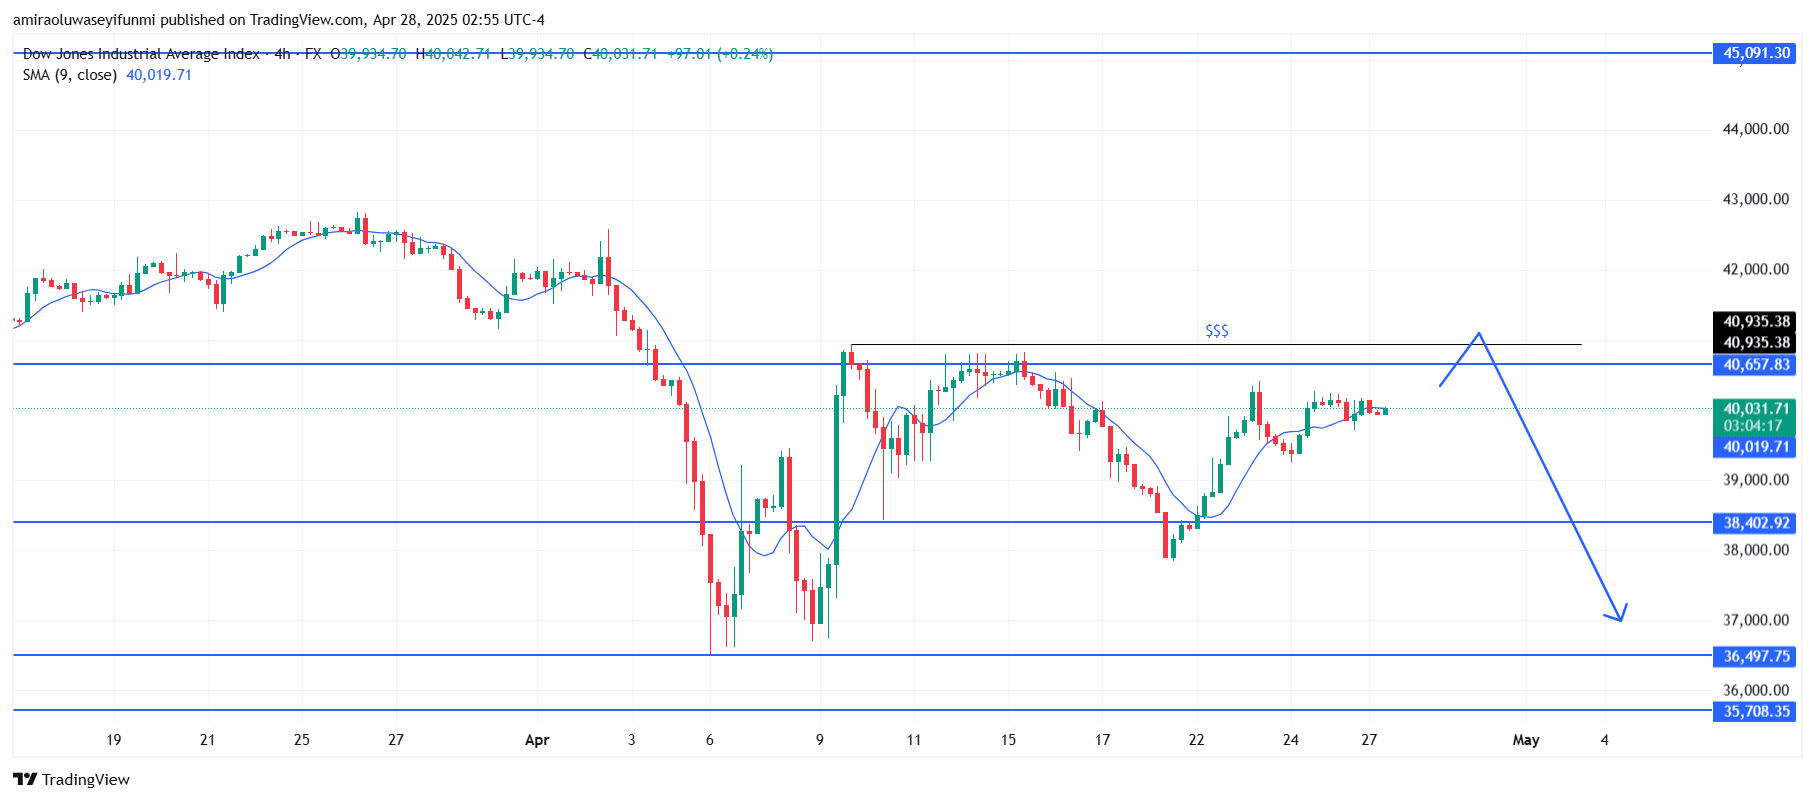
Make money without lifting your fingers: Start using a world-class auto trading solution
How To Buy Lucky Block – Guide, Tips & Insights | Learn 2 Trade
Note: Learn2.trade is not a financial advisor. Do your research before investing your funds in any financial asset, product, or event. We are not responsible for your investment results.
- Broker
- Min Deposit
- Score
- Visit Broker

- Award-winning Cryptocurrency trading platform
- $100 minimum deposit,
- FCA & Cysec regulated

- 20% welcome bonus of upto $10,000
- Minimum deposit $100
- Verify your account before the bonus is credited
- Fund Moneta Markets account with a minimum of $250
- Opt in using the form to claim your 50% deposit bonus
Learn to Trade
Never Miss A Trade Again

Signal Notification
Real-time signal notifications whenever a signal is opened, closes or Updated

Get Alerts
Immediate alerts to your email and mobile phone.

Entry Price Levels
Entry price level for every signal Just choose one of our Top Brokers in the list above to get all this free.