US30 Analysis – July 1
The US30 index continues to display strong bullish momentum above key resistance levels. This is evident in its sustained movement above the 9-day Simple Moving Average, which is currently positioned near $42,720. This moving average has served as dynamic support for the ongoing rally and aligns with the upward trendline originating from the April lows. The daily Relative Strength Index (RSI) has climbed to 68, indicating robust buying interest without entering the overbought zone. The combination of these technical indicators reinforces the prevailing uptrend and suggests ongoing accumulation by market participants.
US30 Key Levels
Resistance Levels: $45,100, $47,000, $48,000
Support Levels: $42,880, $41,740, $40,000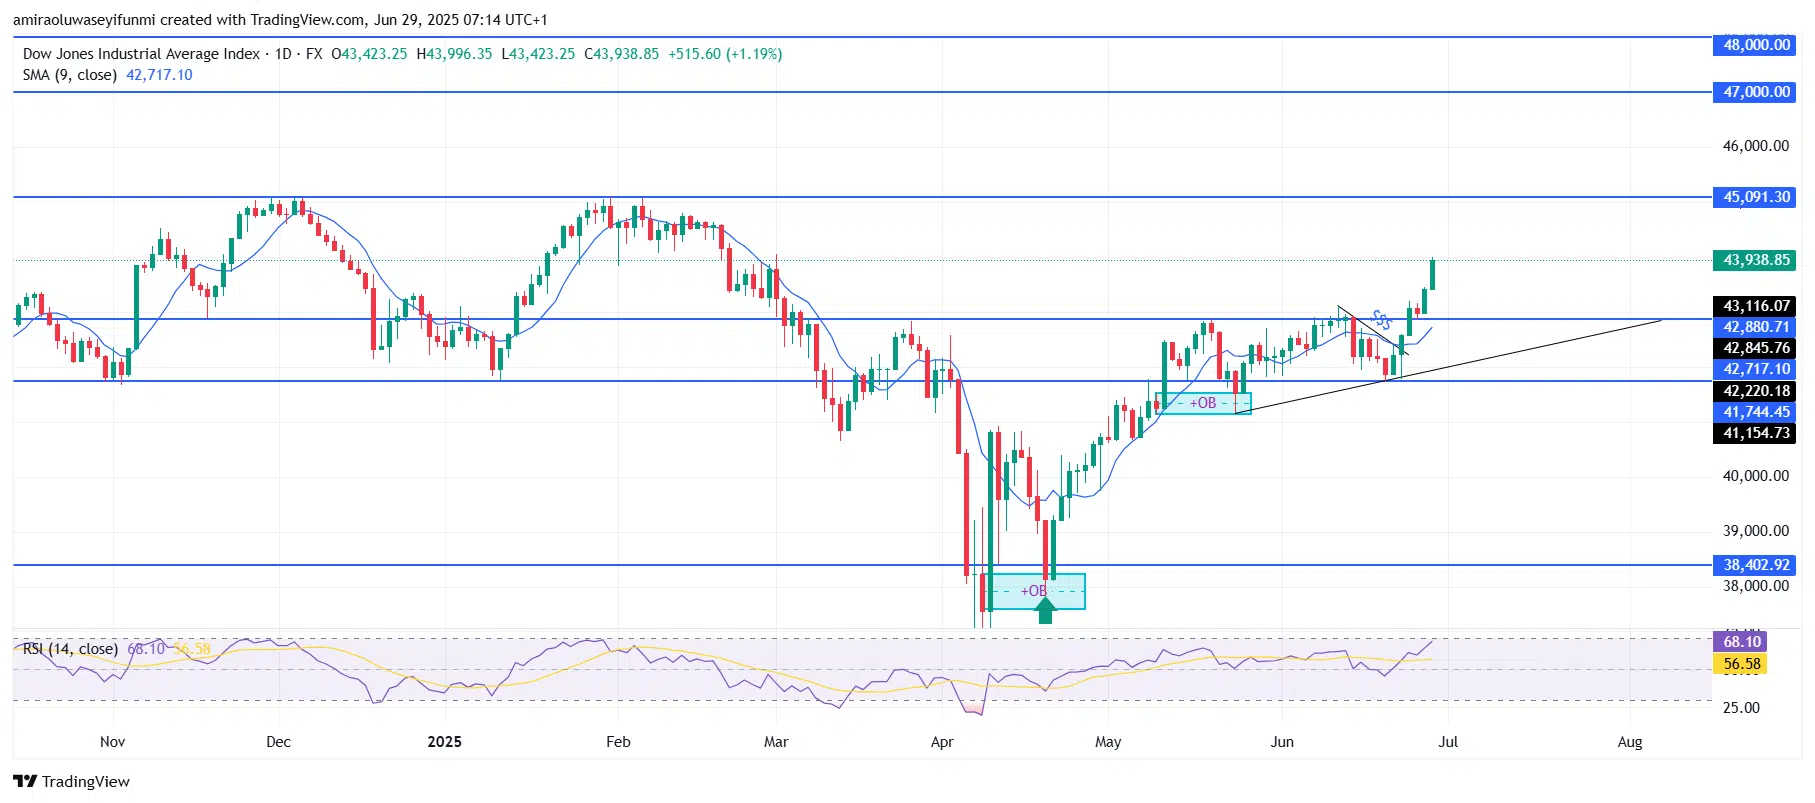
US30 Long-Term Trend: Bullish
The index has successfully broken through the previous resistance zone around $43,120. The breakout candle, backed by a notable increase in volume, highlights the strength of the move. Additionally, the index has continued to form higher lows, affirming the bullish market structure. The strong bounce from the $41,740 support level earlier in June has laid a solid foundation for this upward move, with buyers stepping in firmly to push prices higher.
Looking ahead, the ongoing bullish momentum suggests a potential test of the next resistance near $45,100. If the index sustains its position above $43,120 on a daily closing basis, the likelihood of a continued move toward $47,000 in the medium term increases. A pullback to the $42,880–$42,720 zone could present a healthy correction, offering new entry points for those relying on forex signals to anticipate further upside. Technically, the overall outlook remains favorable, with targets potentially extending toward the $48,000 mark if bullish sentiment continues.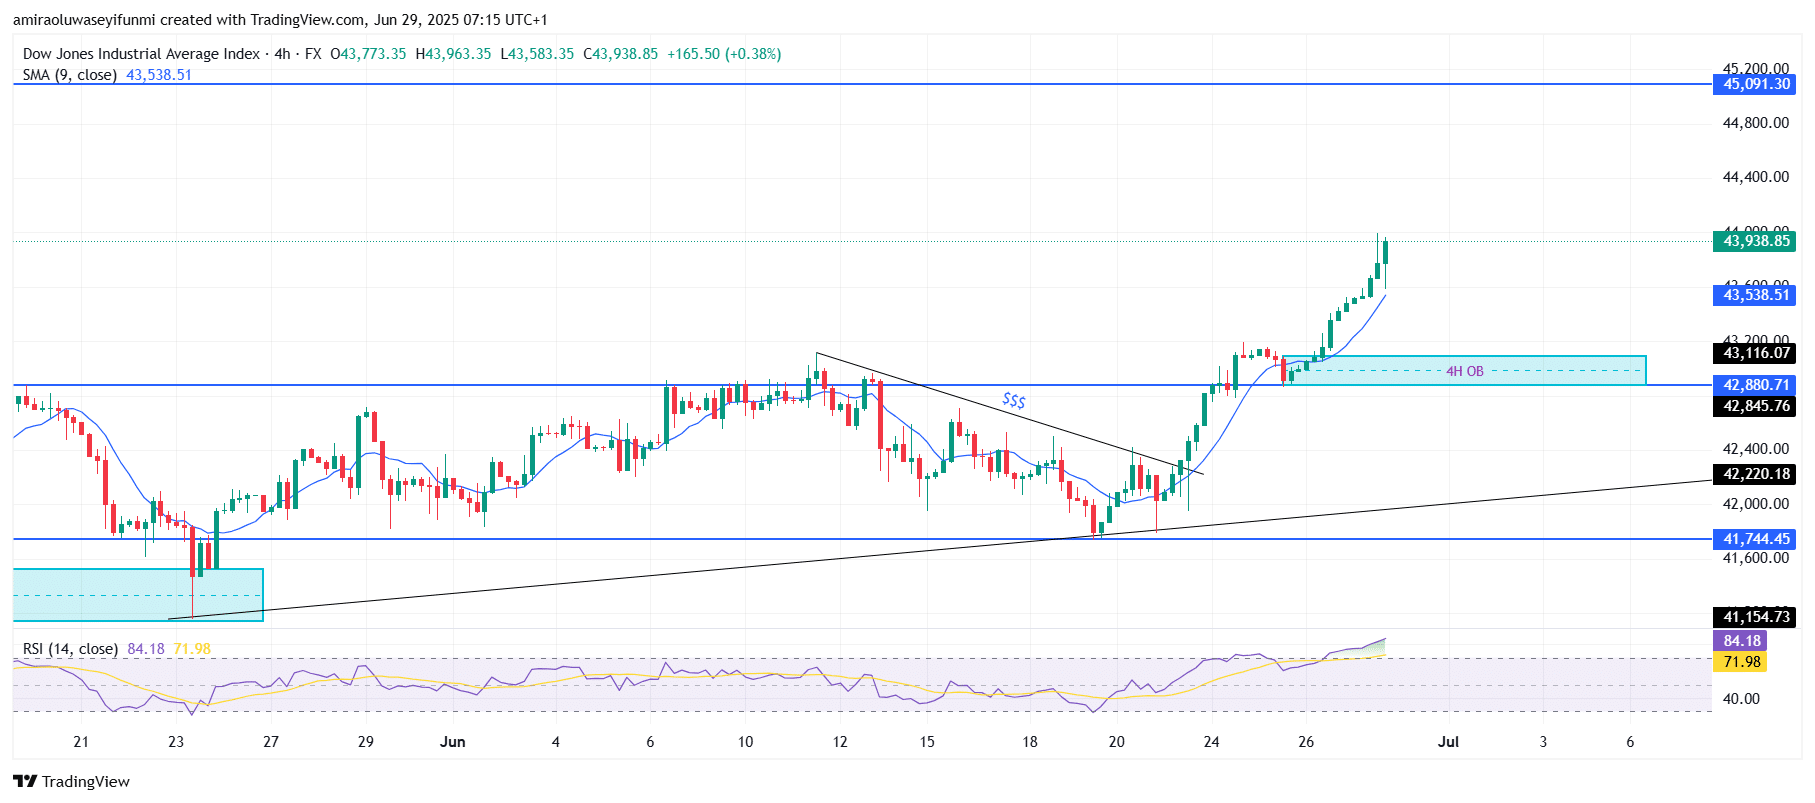
US30 Short-Term Trend: Bearish
The US30 index has extended its rally, breaking convincingly above the $43,120 resistance and currently trading around $43,940. Price action remains supported by the 9-period SMA on the 4-hour chart, indicating sustained upward pressure.
However, the RSI has reached overbought conditions near 84, suggesting a short-term pullback toward the $43,120–$42,880 demand zone may occur. Despite this, the overall structure still favors the bulls, with the next likely target set at the $45,100 resistance level.
Make money without lifting your fingers: Start using a world-class auto trading solution
How To Buy Lucky Block – Guide, Tips & Insights | Learn 2 Trade
Note: Learn2.trade is not a financial advisor. Do your research before investing your funds in any financial asset, product, or event. We are not responsible for your investment results.
- Broker
- Min Deposit
- Score
- Visit Broker

- Award-winning Cryptocurrency trading platform
- $100 minimum deposit,
- FCA & Cysec regulated

- 20% welcome bonus of upto $10,000
- Minimum deposit $100
- Verify your account before the bonus is credited
- Fund Moneta Markets account with a minimum of $250
- Opt in using the form to claim your 50% deposit bonus
Learn to Trade
Never Miss A Trade Again

Signal Notification
Real-time signal notifications whenever a signal is opened, closes or Updated

Get Alerts
Immediate alerts to your email and mobile phone.

Entry Price Levels
Entry price level for every signal Just choose one of our Top Brokers in the list above to get all this free.