US30 Analysis – July 29
US30 shows potential for a retracement within its overall bullish structure. The index has maintained a broadly upward trajectory in recent months, supported by a consistently rising trendline and favorable alignment with the 9-day Simple Moving Average (SMA), currently around $44,680. Momentum indicators, such as the MACD, reveal a narrowing gap between the MACD line and its signal line, indicating a possible short-term bearish correction. Although the underlying trend remains strong, this slight loss of momentum suggests the market may undergo a minor pullback before resuming its upward movement.
US30 Key Levels
Resistance Levels: $45,100, $47,000, $48,000
Support Levels: $42,880, $41,740, $38,400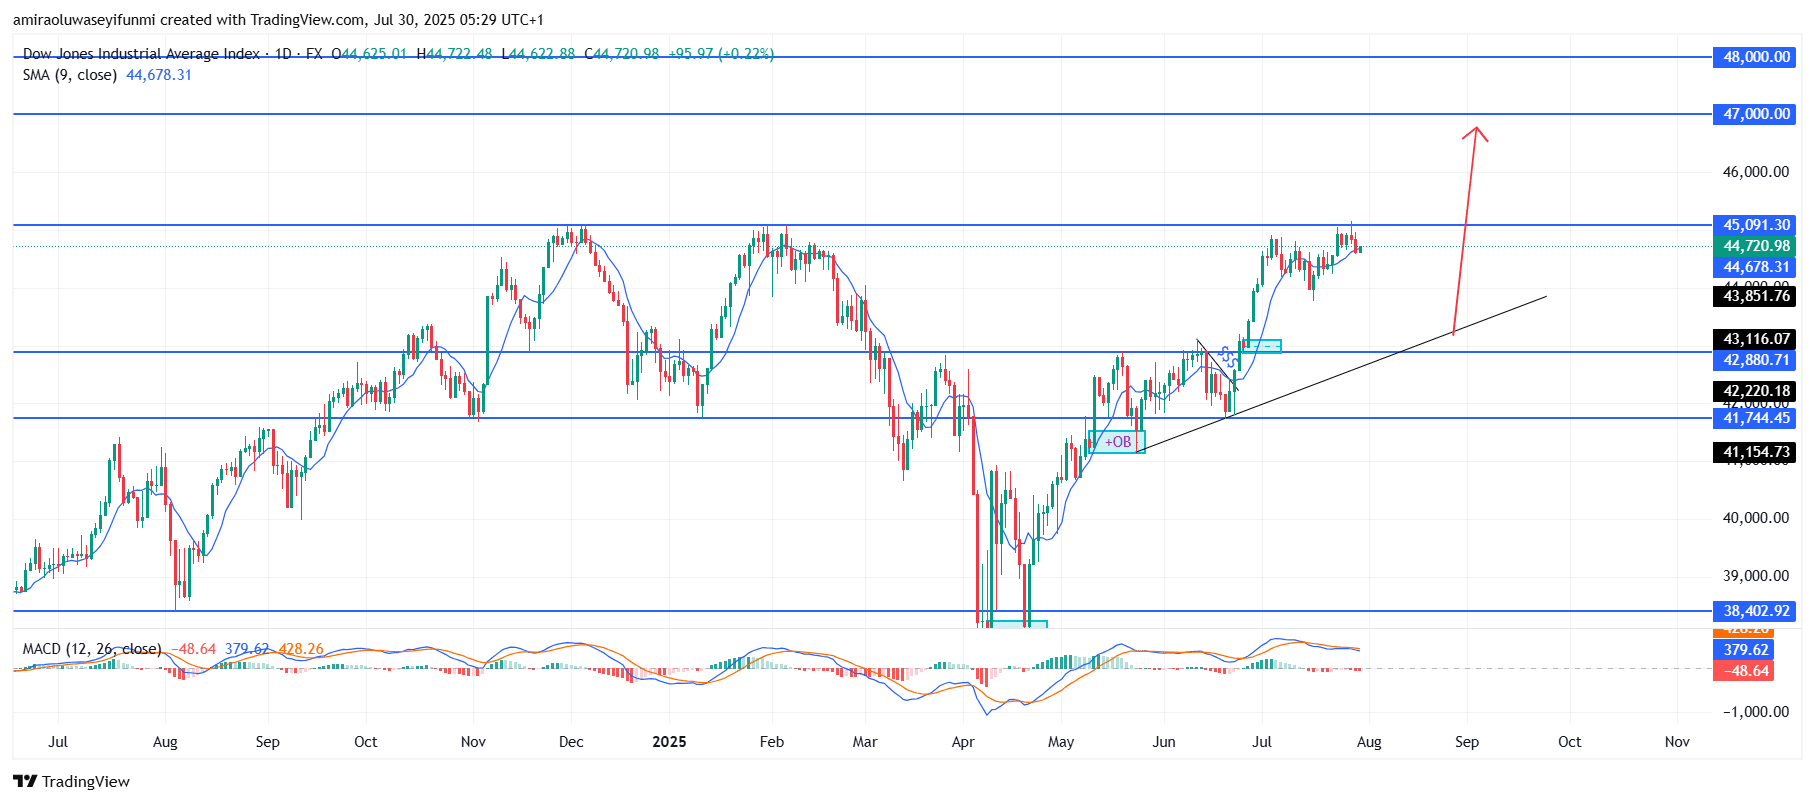
US30 Long-Term Trend: Bullish
Technically, the index is currently testing resistance near the $45,090 level, a previous supply zone that has proven difficult to surpass. If selling pressure emerges, a retracement toward the ascending trendline and key support range between $43,850 and $43,120 is likely.
Importantly, the price remains above a structural support zone and order block around $42,880, reinforcing the broader bullish sentiment despite any short-term corrections. Provided there is a healthy retracement and a rebound from the rising trendline, US30 is expected to continue its upward trajectory. A confirmed daily close above $45,100 could trigger a fresh rally, with medium-term targets at $47,000 and potentially $48,000, supported by accurate forex signals.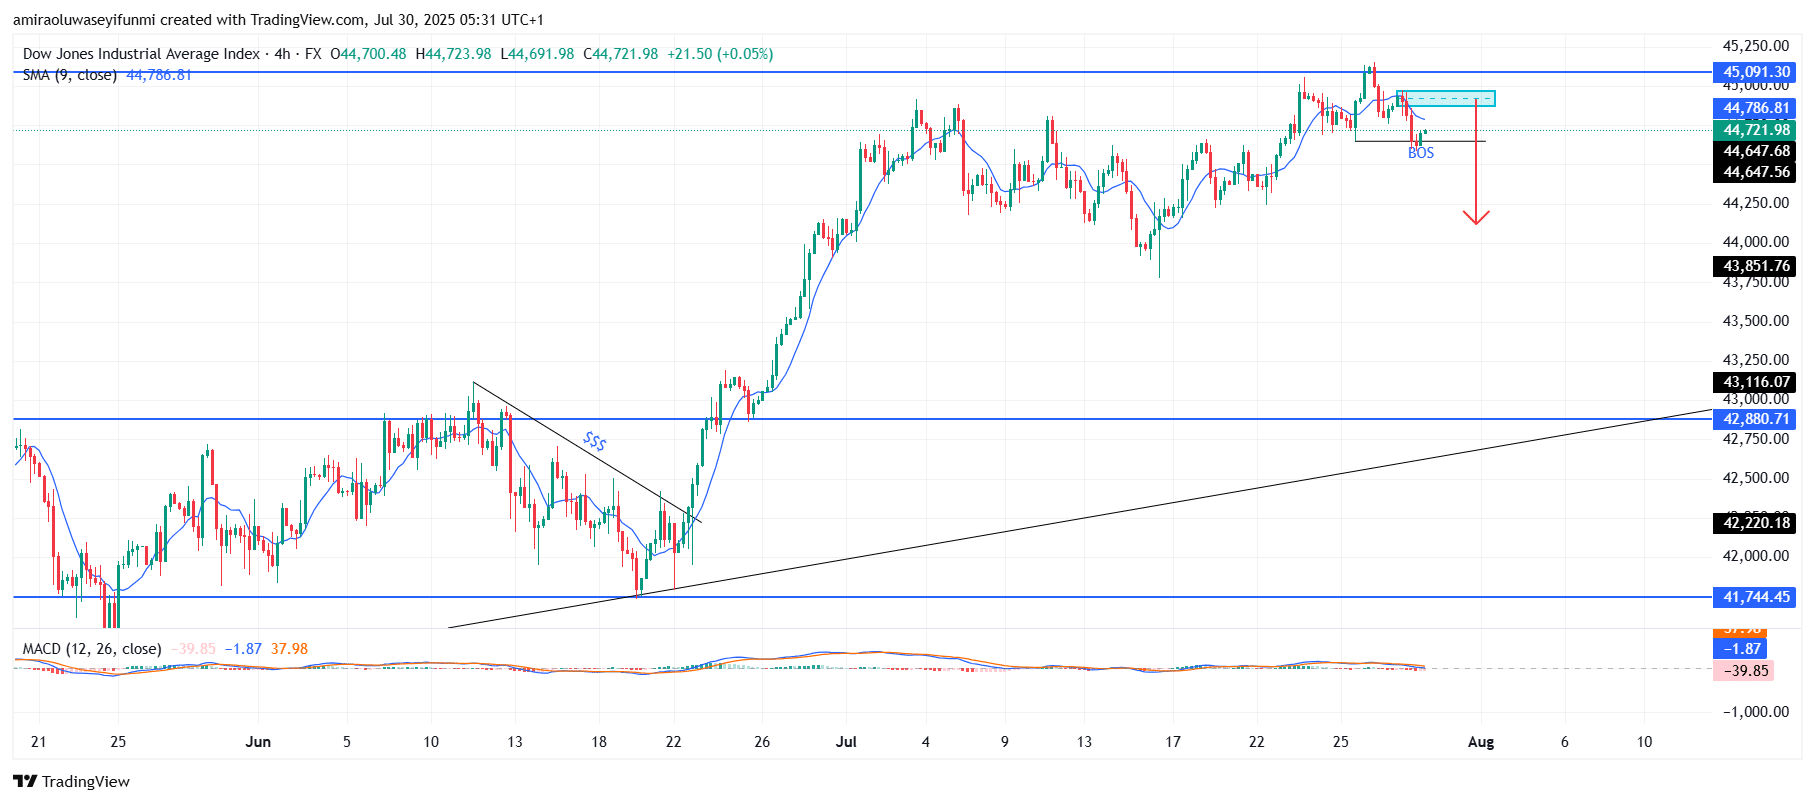
US30 Short-Term Trend: Bearish
In the short term, US30 has broken market structure (BOS) below the $44,700–$44,800 support zone, suggesting initial bearish momentum. The price is currently retesting this area as new resistance, pointing to a possible continuation downward. The 9-period SMA has begun sloping downward, and the MACD histogram shows weakening momentum. If this rejection persists, the price could fall toward the $43,850 or $43,120 levels in the near future.
Make money without lifting your fingers: Start using a world-class auto trading solution
How To Buy Lucky Block – Guide, Tips & Insights | Learn 2 Trade
Note: Learn2.trade is not a financial advisor. Do your research before investing your funds in any financial asset, product, or event. We are not responsible for your investment results.
- Broker
- Min Deposit
- Score
- Visit Broker

- Award-winning Cryptocurrency trading platform
- $100 minimum deposit,
- FCA & Cysec regulated

- 20% welcome bonus of upto $10,000
- Minimum deposit $100
- Verify your account before the bonus is credited
- Fund Moneta Markets account with a minimum of $250
- Opt in using the form to claim your 50% deposit bonus
Learn to Trade
Never Miss A Trade Again

Signal Notification
Real-time signal notifications whenever a signal is opened, closes or Updated

Get Alerts
Immediate alerts to your email and mobile phone.

Entry Price Levels
Entry price level for every signal Just choose one of our Top Brokers in the list above to get all this free.