US30 Analysis – June 18
US30 continues upward as the price sets to invalidate the $39,140 weak high. The Dow Jones Industrial Average’s chart demonstrates a bullish outlook. This bullish outlook is supported by technical indicators such as the 9-day SMA, MACD crossover, and a positive histogram, indicating short-term positive momentum.
US30 Key Levels
Resistance Levels: $40,100, $42,000
Support Levels: $38,020, $37,210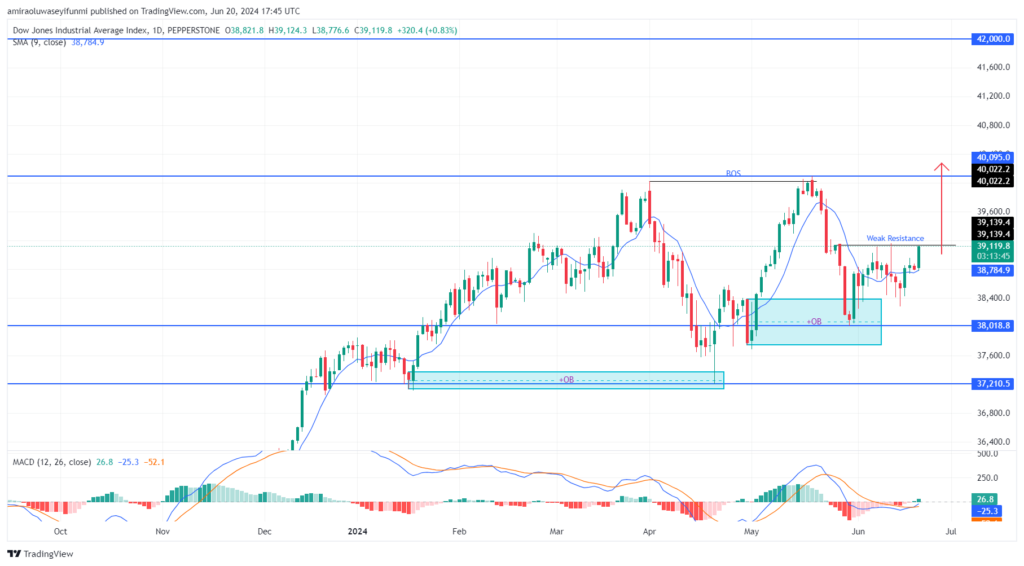
Price action analysis reveals several key levels and patterns contributing to the bullish perspective. The index recently broke above a weak resistance level around $39,140, which has now become a support. The significant resistance level at $40,090 is within reach, with the current price around $39,110. The chart also shows a break of structure (BOS) near $40,020, indicating potential for further gains. Key support zones include the areas around $38,180 and $37,210, which have previously acted as bases for price reversals.
Projection-wise, the bullish trend suggests that the index is likely to test the resistance at $40,090 in the near term. If the price sustains above this level, it could aim for higher resistance around $42,000. Given the strong upward momentum and supportive indicators, a break above $40,090 could lead to a rally toward $42,000. However, should there be a pullback, the price may find support around $38,900 or lower at $38,180, providing opportunities for bullish entries on dips. Incorporating the best forex signals can further assist traders in identifying these key levels and making informed decisions.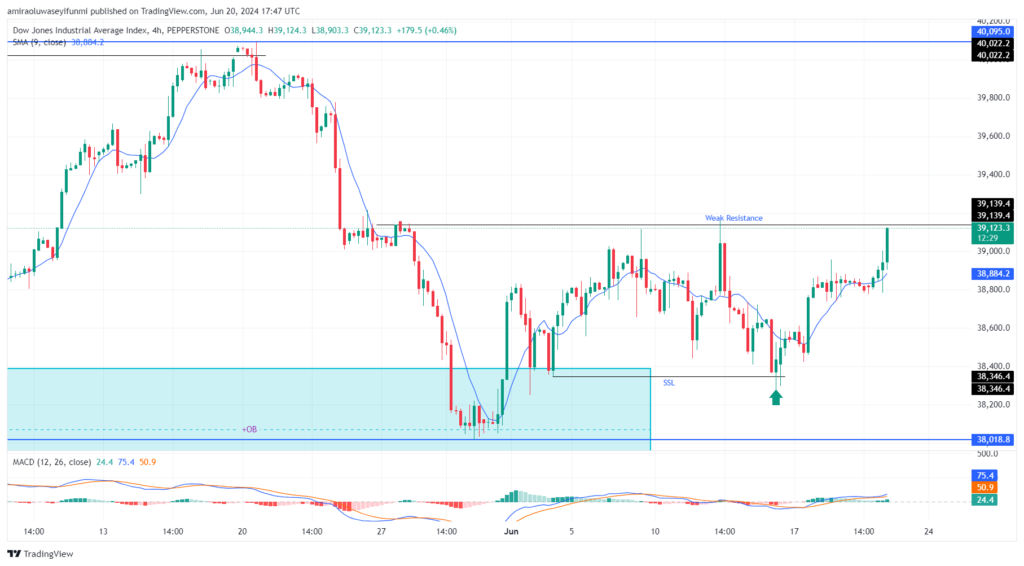
On the four-hour chart, US30 is exhibiting a bullish trend, with strong support at the $38,180 level. The 9-day SMA and MACD line are indicating positive momentum. A break above $39,140 could test resistance at $40,090, potentially leading to further gains.
How To Buy Lucky Block – Guide, Tips & Insights | Learn 2 Trade
Note: Learn2.trade is not a financial advisor. Do your research before investing your funds in any financial asset, product, or event. We are not responsible for your investment results.
- Broker
- Min Deposit
- Score
- Visit Broker

- Award-winning Cryptocurrency trading platform
- $100 minimum deposit,
- FCA & Cysec regulated

- 20% welcome bonus of upto $10,000
- Minimum deposit $100
- Verify your account before the bonus is credited
- Fund Moneta Markets account with a minimum of $250
- Opt in using the form to claim your 50% deposit bonus
Learn to Trade
Never Miss A Trade Again

Signal Notification
Real-time signal notifications whenever a signal is opened, closes or Updated

Get Alerts
Immediate alerts to your email and mobile phone.

Entry Price Levels
Entry price level for every signal Just choose one of our Top Brokers in the list above to get all this free.