US 30 exhibited a bearish trend, marking an impulsive correction within the broader bullish trend in April. However, at the start of May, a failed low on the daily chart signalled the resumption of the uptrend, culminating in a new high that reinforced the bullish outlook. Recently, the market has dipped into discounted levels on the daily chart’s most recent bullish swing.
US 30 Key Levels
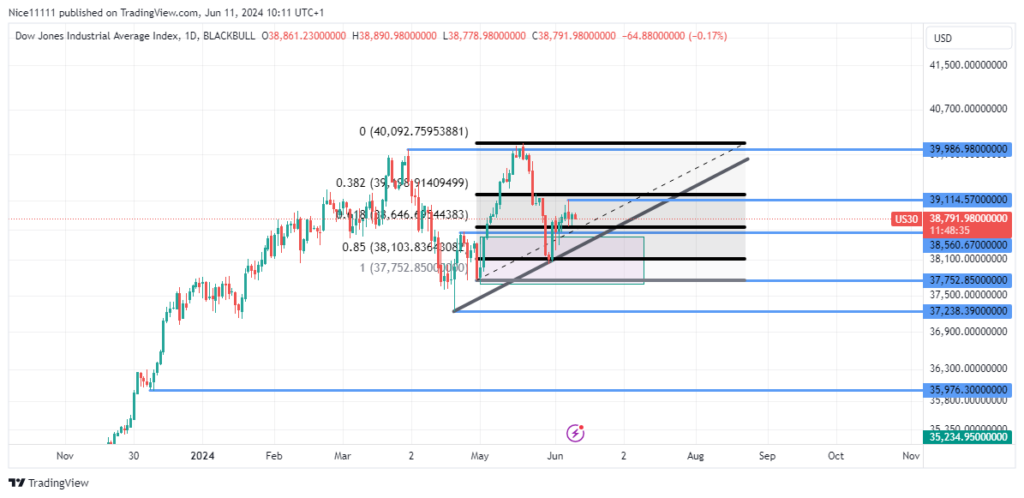
Demand Levels: 38560.0, 37750.0, 37238.0
Supply Levels: 39115.0, 39986.0, 40000.0
US 30 Long-Term Trend: Bullish
The sharp decline in US 30 during April appears to have been a strategic move to clear out liquidity regions, setting the stage for a new high. The proximity of multiple swing lows typically indicates high trade volumes due to the concentration of liquidity. This downward movement paused after the price filled the fair value gap at 37238.0.
The formation of a double bottom at the beginning of May positioned the market for an upward climb. The price surged, establishing a new high, and has since experienced a notable pullback to the bullish order block at 38560.0.
The price has penetrated the bullish order block, reaching 80% of the depth of the bullish swing. The best forex signals entry are often found when buying below the 50% level, as deeper discount levels generally offer better risk-to-reward ratios.
US 30 Short-Term Trend: Bullish
On the 4-hour chart, a new bullish market structure is emerging. The anticipated continuation of the uptrend is expected to challenge and potentially surpass the previous high of 39986.0.
You can purchase Lucky Block – Guide, Tips & Insights | Learn 2 Trade here. Buy LBLOCK
Note: Learn2.trade is not a financial advisor. Do your research before investing your funds in any financial asset or presented product or event. We are not responsible for your investing results.
Trade on MT4 with Leverage up to 1:500! Trade on MT4 with Leverage up to 1:500!
X
We use cookies to ensure that we give you the best experience on our website. If you continue to use this site we will assume that you are happy with it.

 US 30 Short-Term Trend: Bullish
 US 30 Short-Term Trend: Bullish


