Key Resistance Zones: 28500, 29000, 29500
Key Support Zones: 26000, 25500, 25000
US Wall Street 30 (US30USD) Long-term Trends: Bullish
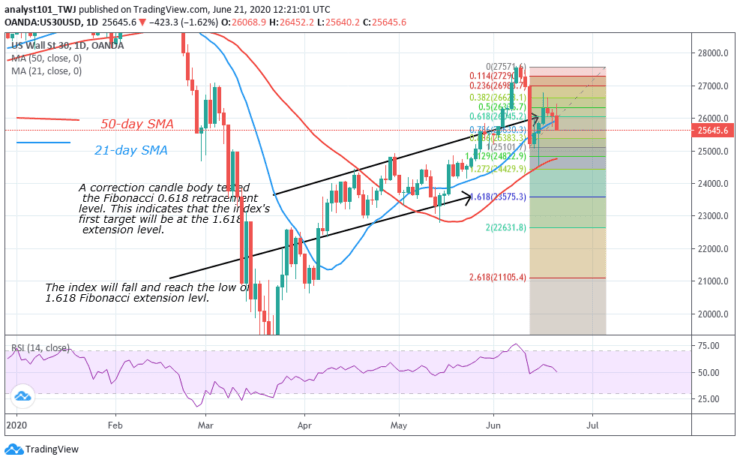
US Wall Street 30 index is currently falling after reaching the overbought region. The index rose to a high of 27583 and was resisted. A correction candle body tested the Fibonacci 0.618 retracement level. It indicates that the index’s first target will be at the 1.618 extension level. Later, the price action will continue.
Daily Chart Indicators Reading:
The 21-day SMA and the 50-day SMA are sloping upward. The SMAs indicates the previous trend. The price has fallen to level 50 of the RSI period 14. At the moment, the index is in the uptrend zone.
US Wall Street 30 (US30USD) Medium-term Trend: Bullish
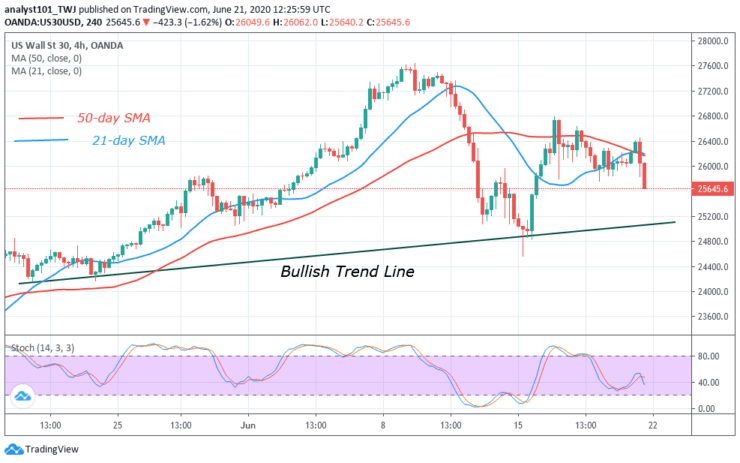
On the 4-hour chart, the index is falling. The bulls retested the level 26800 and were resisted. Buyers made three attempts to move up but were repelled. The index will fall to level 1.618 Fibonacci extension level. In other words, the market will fall to level 23561.
4-hour Chart Indicators Reading
US30USD is now below 40% range of the daily stochastic. It indicates that the market is in the bearish momentum. The SMAs are still sloping horizontally.
General Outlook for US Wall Street 30 (US30USD)
US30USD index is in a downtrend. The indicators are pointing downward. The price bars have broken below the EMAs. It indicates a further downward movement of the index.
Note: Learn2Trade.com is not a financial advisor. Do your research before investing your funds in any financial asset or presented product or event. We are not responsible for your investing results
- Broker
- Min Deposit
- Score
- Visit Broker

- Award-winning Cryptocurrency trading platform
- $100 minimum deposit,
- FCA & Cysec regulated

- 20% welcome bonus of upto $10,000
- Minimum deposit $100
- Verify your account before the bonus is credited
- Fund Moneta Markets account with a minimum of $250
- Opt in using the form to claim your 50% deposit bonus
Learn to Trade
Never Miss A Trade Again

Signal Notification
Real-time signal notifications whenever a signal is opened, closes or Updated

Get Alerts
Immediate alerts to your email and mobile phone.

Entry Price Levels
Entry price level for every signal Just choose one of our Top Brokers in the list above to get all this free.