Key Resistance Zones: 35000, 35500, 36000
Key Support Zones: 27000, 26500, 26000
US Wall Street 30 (US30USD) Long-term Trend: Bearish
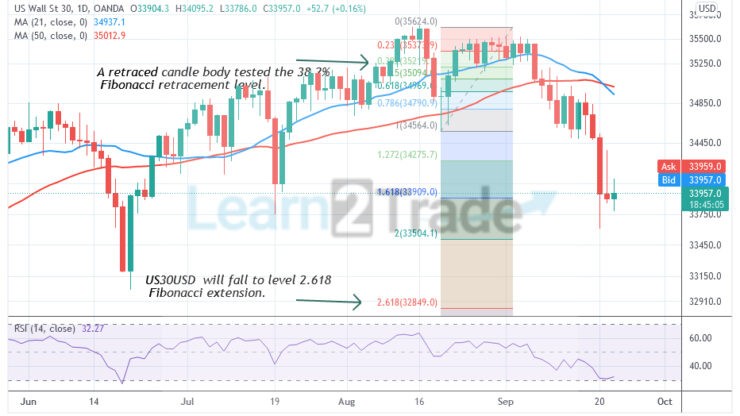
US30USD has fallen below the moving averages. The implication is that further downsides are possible. Today, US Wall Street 30 has declined to the low of level 33600 as bulls bought the dips. Presently, the index price is consolidating above level 33800. Meanwhile, on the August 19 downtrend, a retraced candle body tested the 38.2% Fibonacci retracement level. The retracement indicates that US30USD will fall to level 2.618 Fibonacci extension or level 32849.00.
US Wall Street 30 Daily Chart Indicators Reading:
The index is at level 32 of the Relative Strength Index period 14. It indicates that it is in the bearish trend zone and approaching the oversold region of the market. The 21-day and 50 –day SMAs are sloping downward indicating the downward downtrend.
US Wall Street 30 (US30USD) Medium-term Trend: Bearish
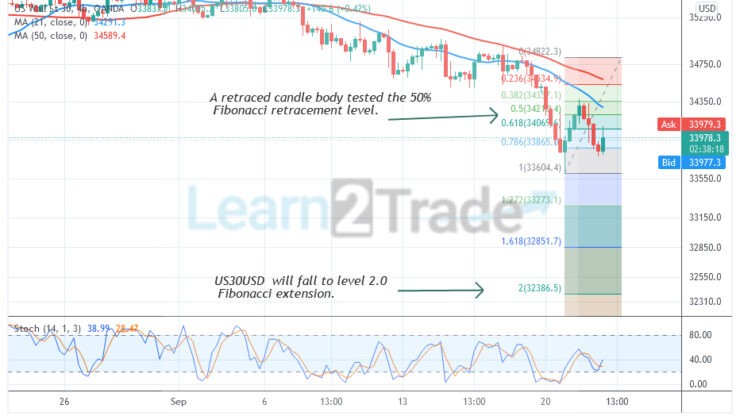
On the 4-hour chart, the index price is in a downward move. The price retested the support at level 13616 twice but could not break below it. Meanwhile, on September 20 down, a retraced candle body tested the 50% Fibonacci retracement level. The retracement indicates that US30USD will fall to level 2.0 Fibonacci extension or level 32851.70.
4-hour Chart Indicators Reading
US30USD is above the 25% range of the daily stochastic. This implies that the market is in a bullish momentum. The 21-day and 50-day SMAs are sloping downward indicating the downtrend.
General Outlook for US Wall Street 30 (US30USD)
US Wall Street 30 is in a downward move. The index price bars are still below the moving averages which suggests a further downward move. The index will rise if price breaks above the moving averages. Presently, the downtrend has been stuck above level 33550.
You can purchase crypto coins here: Buy Tokens
Note: Learn2Trade is not a financial advisor. Do your research before investing your funds in any financial asset or presented product or event. We are not responsible for your investing results
- Broker
- Min Deposit
- Score
- Visit Broker

- Award-winning Cryptocurrency trading platform
- $100 minimum deposit,
- FCA & Cysec regulated

- 20% welcome bonus of upto $10,000
- Minimum deposit $100
- Verify your account before the bonus is credited
- Fund Moneta Markets account with a minimum of $250
- Opt in using the form to claim your 50% deposit bonus
Learn to Trade
Never Miss A Trade Again

Signal Notification
Real-time signal notifications whenever a signal is opened, closes or Updated

Get Alerts
Immediate alerts to your email and mobile phone.

Entry Price Levels
Entry price level for every signal Just choose one of our Top Brokers in the list above to get all this free.