STELLAR Price Analysis – September 22
In case the bears are able to push the price below the support level of $0.24 and the daily candle closes below it, then, Stellar price may reduce to the previous low of $0.19 levels and may extend to $0.14. When the buyers defend the support level of $0.24, price may commence its bullish trend towards the resistance levels of $0.30, $0.34, and $0.48.
XLM/USD Market
Key Levels:
Resistance levels: $0.30, $0.34, $0.48
Support levels: $0.24, $0.19, $0.14
XLM/USD Long-term Trend: Bearish
Stellar is bearish on the daily chart. Two weeks ago, the buyers lost momentum at the resistance level of $0.42. The bears took over the market with the formation of big daily bearish candle which engulfs the previous candles. The price declines and broke down the support levels of $0.35 and $0.30. It is moving down towards the support level of $0.24. Increase in the bears’ pressure may break down the support level at $0.24.
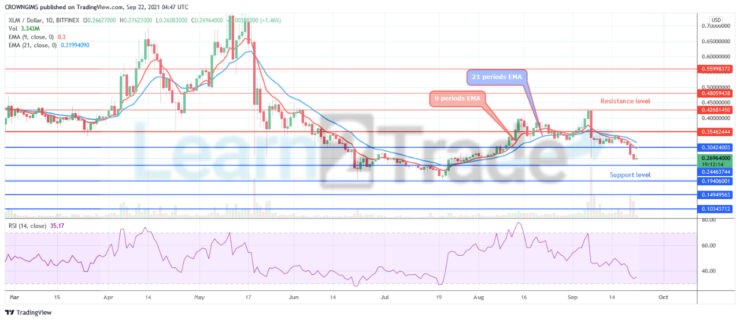
Stellar has broken down the dynamic support levels. Stellar is trading below the 9 periods EMA and 21 periods EMA at a distance range. In case the bears are able to push the price below the support level of $0.24 and the daily candle closes below it, then, Stellar price may reduce to the previous low of $0.19 levels and may extend to $0.14. When the buyers defend the support level of $0.24, price may commence its bullish trend towards the resistance levels of $0.30, $0.34, and $0.48.
XLM/USD Medium-term Trend: Bearish
Stellar is on the bearish movement in the 4-hour chart. The crypto was on the ranging movement last week within the resistance level of $0.35 and support level of $0.30. On September 20, the bears prevail over the bulls to breakout at the support level of $0.30. The price is heading towards the support level of $0.24.
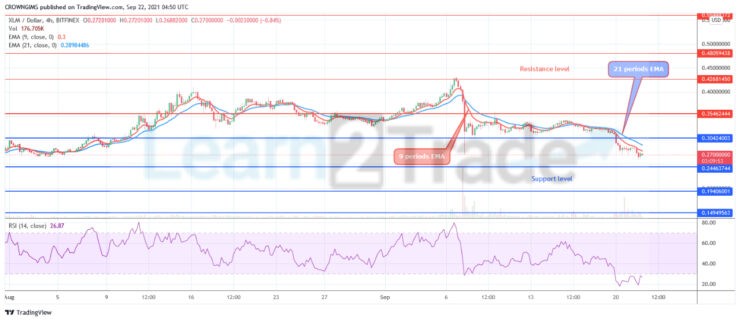
Stellar is currently trading below 9 periods EMA and 21 periods EMA as a sign of bearish market. The Relative Strength Index periods 14 is at 30 levels and the signal line pointing up to indicate a buy signal which may be a pullback.
You can purchase crypto coins here. Buy Tokens
- Broker
- Min Deposit
- Score
- Visit Broker

- Award-winning Cryptocurrency trading platform
- $100 minimum deposit,
- FCA & Cysec regulated

- 20% welcome bonus of upto $10,000
- Minimum deposit $100
- Verify your account before the bonus is credited
- Fund Moneta Markets account with a minimum of $250
- Opt in using the form to claim your 50% deposit bonus
Learn to Trade
Never Miss A Trade Again

Signal Notification
Real-time signal notifications whenever a signal is opened, closes or Updated

Get Alerts
Immediate alerts to your email and mobile phone.

Entry Price Levels
Entry price level for every signal Just choose one of our Top Brokers in the list above to get all this free.