Key Resistance Zones: 35000, 35500, 360
Key Support Zones: 27000, 26500, 26000
US Wall Street 30 (US30USD) Long-term Trend: Bearish
US30USD has resumed a downward move after failing to break above level 34850. The bulls have been repelled thrice as the index attempt to break above the recent high. US Wall Street 30 is falling and has reached the low of 34160. However, in previous price action, the bears are also finding it difficult to break below level 33800.
Since July, the previous low has not been broken. Incidentally, the market is fluctuating between levels 33800 and 34850. The index will trend when these levels are breached. Meanwhile, on October 1 downtrend; a retraced candle body tested the 50% Fibonacci retracement level. The retracement indicates that US30USD will fall to level 2.0 Fibonacci extension or level 32023. 70 .
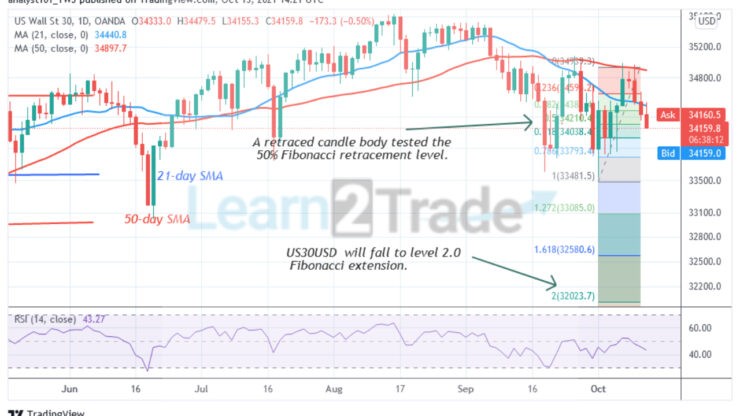
US Wall Street 30 Daily Chart Indicators Reading:
US30USD is at level 44 of the Relative Strength Index period 14. It indicates that it is in the bearish trend zone and below centerline 50. The 21-day and 50 –day SMAs are sloping downward indicating the downtrend.
US Wall Street 30 (US30USD) Medium-term Trend: Bearish
On the 4-hour chart, the index resumed a downward move after rejection from level 35000. A Further downward move is likely as the index breaks below the moving averages. Meanwhile, on October 12 downtrend; a retraced candle body tested the 61.8% Fibonacci retracement level. The retracement indicates that US30USD will fall to level 1.618 Fibonacci extension or level 33860. 80.
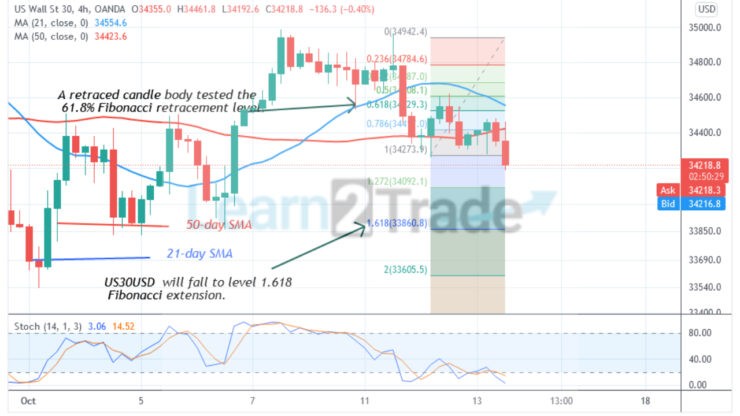
4-hour Chart Indicators Reading
US30USD is below the 20% range of the daily stochastic. The index has fallen to the oversold region. The selling pressure is likely to end. The 21-day and 50-day SMAs are sloping downward indicating the previous trend.
General Outlook for US Wall Street 30 (US30USD)
US Wall Street 30 has reached bearish exhaustion as the index consolidates above level 33800. Since September 20, the index has been in a downward correction as it fluctuates between levels 33800 and 35000. The market will trend when these levels are breached.
You can purchase crypto coins here: Buy Tokens
Note: Learn2Trade is not a financial advisor. Do your research before investing your funds in any financial asset or presented product or event. We are not responsible for your investing results
- Broker
- Min Deposit
- Score
- Visit Broker

- Award-winning Cryptocurrency trading platform
- $100 minimum deposit,
- FCA & Cysec regulated

- 20% welcome bonus of upto $10,000
- Minimum deposit $100
- Verify your account before the bonus is credited
- Fund Moneta Markets account with a minimum of $250
- Opt in using the form to claim your 50% deposit bonus
Learn to Trade
Never Miss A Trade Again

Signal Notification
Real-time signal notifications whenever a signal is opened, closes or Updated

Get Alerts
Immediate alerts to your email and mobile phone.

Entry Price Levels
Entry price level for every signal Just choose one of our Top Brokers in the list above to get all this free.