Key Resistance Zones: 28500, 29000, 29500
Key Support Zones: 26000, 25500, 25000
US Wall Street 30 (US30USD) Long-term Trends: Ranging
US Wall Street 30 index is fluctuating between levels 25000 and 27000 since June 10. The index is falling after testing the resistance line twice. The price has not broken the key levels of the price range in the last one month. The current downward move may terminate at either level 25000 or 26000.
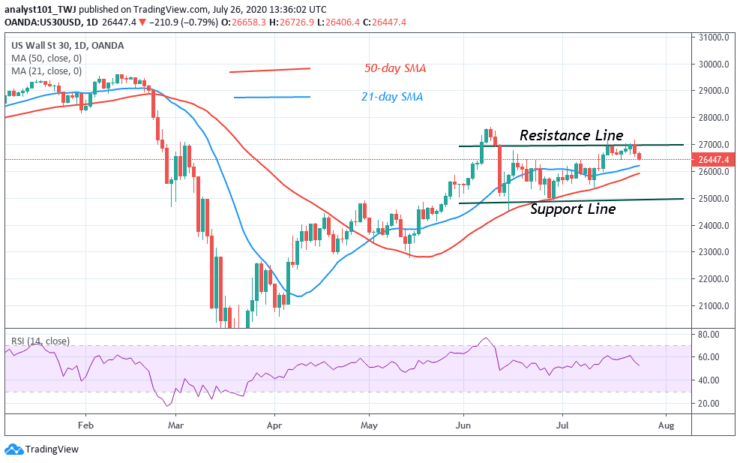
Daily Chart Indicators Reading:
The 21-day SMA and the 50-day SMA are sloping sideways. It indicates the market is in a sideways move. The price has fallen to level 56 of the RSI period 14. The market is in an uptrend zone and it is above the centerline 50.
US Wall Street 30 (US30USD) Medium-term Trend: Ranging
On the 4-hour chart, the index has been fluctuating between levels 24800 and 27200. The levels have not been broken for the past month. In the meantime, the price has tested the resistance line twice before negotiating a downward move.
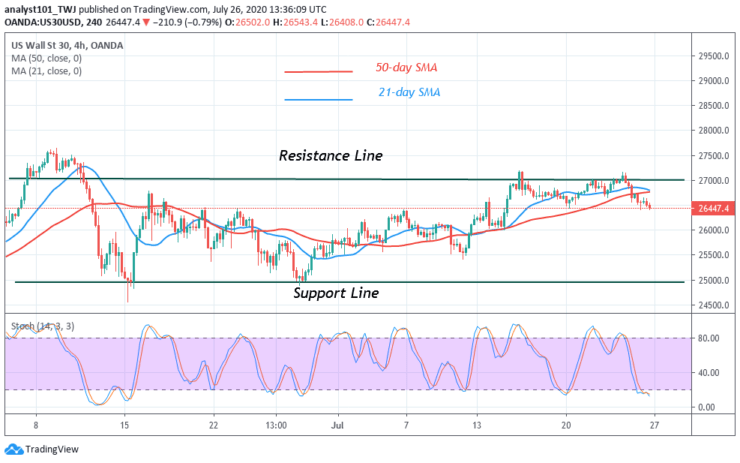
4-hour Chart Indicators Reading
US30USD is below 20 % range of the daily stochastic. This indicates that the market is in the oversold region. The SMAs are sloping horizontally indicating the sideways trend.
General Outlook for US Wall Street 30 (US30USD)
US30USD index is still fluctuating within a confined price range. The range-bound levels are yet to be broken. The index will trend when these levels are broken. In the meantime, the market is falling toward the support line. The downward move may terminate in the middle of price range.
Note: Learn2Trade.com is not a financial advisor. Do your research before investing your funds in any financial asset or presented product or event. We are not responsible for your investing results
- Broker
- Min Deposit
- Score
- Visit Broker

- Award-winning Cryptocurrency trading platform
- $100 minimum deposit,
- FCA & Cysec regulated

- 20% welcome bonus of upto $10,000
- Minimum deposit $100
- Verify your account before the bonus is credited
- Fund Moneta Markets account with a minimum of $250
- Opt in using the form to claim your 50% deposit bonus
Learn to Trade
Never Miss A Trade Again

Signal Notification
Real-time signal notifications whenever a signal is opened, closes or Updated

Get Alerts
Immediate alerts to your email and mobile phone.

Entry Price Levels
Entry price level for every signal Just choose one of our Top Brokers in the list above to get all this free.