
Key Resistance Zones: 34000, 34500, 35000
Key Support Zones: 27000, 26500, 26000
US Wall Street 30 (US30USD) Long-term Trend: Bullish
Presently, US30USD is in a downward move. The index is falling after reaching a high of 34270.40. Today, the market has declined to the low of level 33737.0. There is the possibility of a further downward move as price approaches the 21-day SMA. The market is declining because the index has earlier reached the overbought region of the market.
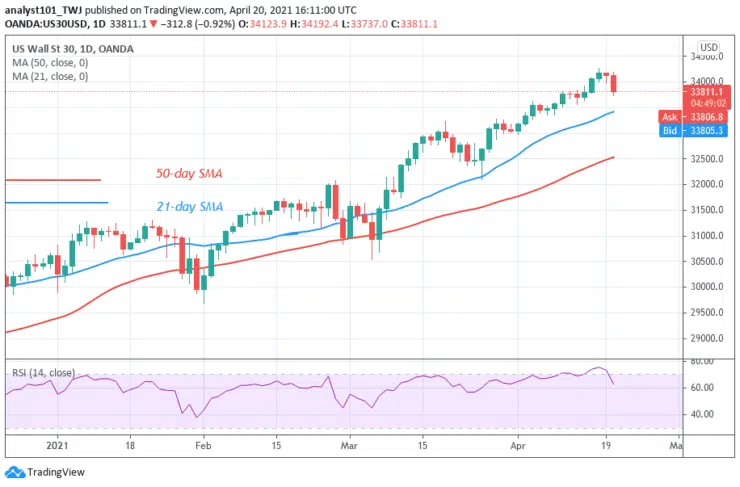
Daily Chart Indicators Reading:
US30USD has fallen from level 75 to level 63 of the Relative Strength Index period 14. It indicates that the index is in the uptrend zone and can rise. The 21-day and the 50-day SMAs are sloping northward indicating a previous trend.
US Wall Street 30 (US30USD) Medium-term Trend: Bearish
On the 4-hour chart, the index is in a downtrend. Initially, US Wall Street declined to level 34000 and after retesting level 34200, the selling pressure resumed. Meanwhile, on April 19 downtrend; a retraced candle body tested the 38.2% Fibonacci retracement level. This implies that US30USD will fall to level 2.618 Fibonacci extension or the low of 33553.30.


