Key Resistance Zones: 28500, 29000, 29500
Key Support Zones: 26000, 25500, 25000
US Wall Street 30 (US30USD) Long-term Trends: Bullish
US Wall Street 30 index is rising and in an ascending channel. The market in its bullish move has fallen to level 23000 low. The current support is holding as the market resume upward move. On the upside, if price breaks the resistance of 24000, the price will rally above level 25000.
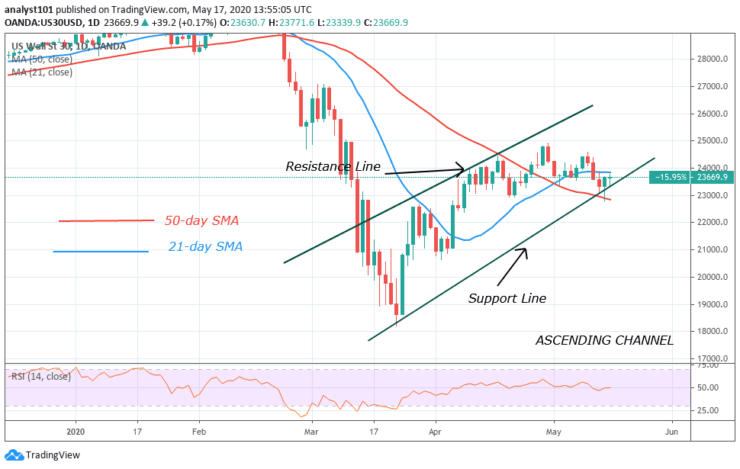
Daily Chart Indicators Reading:
The SMAs have a bullish crossover as the 21-day crosses over the 50-day SMA indicating an upward move. The price has fallen to level 49 of the RSI period 14. The market is in a downtrend zone and it is below the centerline 50. The index has bullish signals.
US Wall Street 30 (US30USD) Medium-term Trend: Bullish
On the 4-hour chart, the index is in an ascending channel. Price breaks the support line and closes below it. Technically, the downtrend should have resumed rather the uptrend has resumed. On the upside, the index is likely to break above the support line.
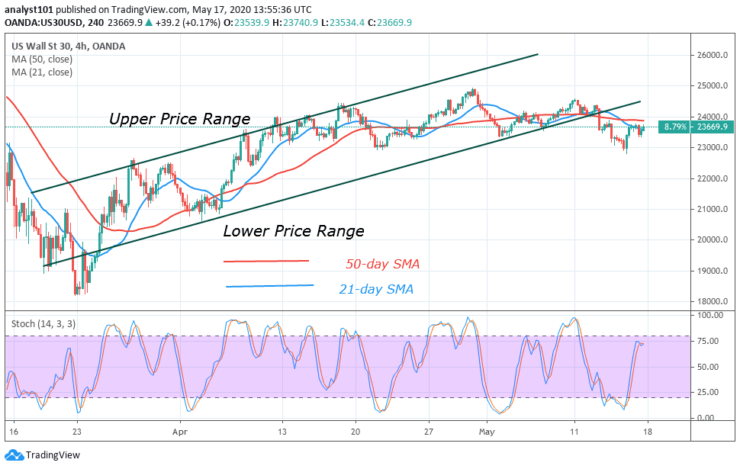
4-hour Chart Indicators Reading
US30USD is now above 60 % range of the daily stochastic. This indicates that the market is in a bullish momentum. The uptrend has resumed as prices rise to break above the support line.
General Outlook for US Wall Street 30 (US30USD)
US30USD index was in a downtrend. The market is rising to retest the previous highs. On the upside, US Wall Street 30 is likely to face resistances at level 24000 and 25000. The SMAs have a bullish crossover and stochastic is indicating bullish signals.
Note: Learn2Trade.com is not a financial advisor. Do your research before investing your funds in any financial asset or presented product or event. We are not responsible for your investing results
- Broker
- Min Deposit
- Score
- Visit Broker

- Award-winning Cryptocurrency trading platform
- $100 minimum deposit,
- FCA & Cysec regulated

- 20% welcome bonus of upto $10,000
- Minimum deposit $100
- Verify your account before the bonus is credited
- Fund Moneta Markets account with a minimum of $250
- Opt in using the form to claim your 50% deposit bonus
Learn to Trade
Never Miss A Trade Again

Signal Notification
Real-time signal notifications whenever a signal is opened, closes or Updated

Get Alerts
Immediate alerts to your email and mobile phone.

Entry Price Levels
Entry price level for every signal Just choose one of our Top Brokers in the list above to get all this free.